Shivalik Bimetal

  • Market Cap: Small Cap
  • Industry: Iron & Steel Products
  • ISIN: INE386D01027
  • NSEID: SBCL
  • BSEID: 513097
INR
920.25
153.35 (20.0%)
BSENSE

Aug 07, 03:30 PM

BSE+NSE Vol: 64.59 lacs

  • Price Points
  • Score
  • Mojo Parameters
  • Total Return
  • News and Corporate Actions
  • Key factors
  • Shareholding
  • Financials
  • CompanyCV
stock-summaryPrice Point
High/Low

1Day

52 Week

Valuation
Technical
Day's Volume

CASH

64.59 lacs (308.42%) Volume

Shareholding (Jun 2026)

FII

2.04%

Held by 41 FIIs

DII

14.54%

Held by 12 DIIs

Promoter

33.61%

Why is Shivalik Bimetal Controls Ltd falling/rising?

08-Aug-2026

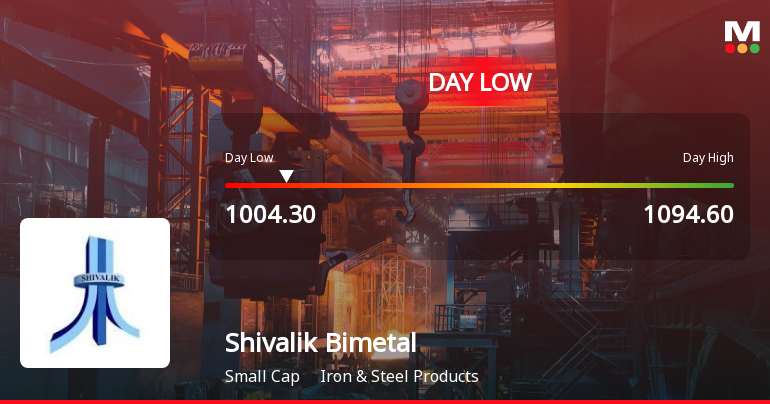
As of 07-Aug, Shivalik Bimetal Controls Ltd's stock price has risen to Rs 920.25, up 20.0%, driven by strong performance, positive financial results, and increased investor interest. The stock has significantly outperformed the market and is trading above its moving averages, indicating bullish sentiment.

As of 07-Aug, Shivalik Bimetal Controls Ltd is experiencing a significant rise in its stock price, currently at Rs 920.25, reflecting an increase of Rs 153.35 or 20.0%. This upward movement can be attributed to several key factors. <BR><BR>Firstly, the stock has shown impressive performance over various time frames, with a year-to-date increase of 114.19%, significantly outperforming the Sensex, which has declined by 7.89% during the same period. Additionally, the stock has gained 22.87% over the past week and 27.32% over the past month, indicating strong momentum.<BR><BR>Today's trading session has been particularly noteworthy, as the stock opened with a 10% gain and reached a new 52-week and all-time high of Rs 920.25. This performance has outpaced its sector by 19.95%, suggesting robust investor interest. Furthermore, the stock has reversed a trend of two consecutive days of decline, signaling renewed buying activity.<BR><BR>The increase in investor participation is also a contributing factor, with delivery volume rising by 76.3% compared to the five-day average. This indicates a higher level of confidence among investors. Moreover, Shivalik Bimetal is trading above its moving averages across multiple time frames, which typically reflects a bullish sentiment.<BR><BR>Financially, the company has demonstrated high management efficiency with a return on equity (ROE) of 24.46% and has reported record net sales and cash equivalents in its latest quarterly results. These positive financial indicators, combined with the stock's strong historical performance, have likely attracted more buyers, further driving up the price.<BR><BR>In summary, the rise in Shivalik Bimetal Controls Ltd's stock price is supported by strong recent performance, positive financial results, increased investor participation, and a favorable market trend.

View full answer

Should I buy, sell or hold Shivalik Bimetal Controls Ltd?

07-Aug-2026

When is the next results date for Shivalik Bimetal Controls Ltd?

31-Jul-2026

The next results date for Shivalik Bimetal Controls Ltd is August 6, 2026.

The next results date for Shivalik Bimetal Controls Ltd is scheduled for August 6, 2026.

View full answer

How big is Shivalik Bimetal?

11-Jun-2026

As of 10th June, Shivalik Bimetal Controls Ltd has a market capitalization of 4,124.00 Cr, with net sales of 570.86 Cr and net profit of 95.86 Cr over the latest four quarters.

As of 10th June, <BR><BR>Market Cap: Shivalik Bimetal Controls Ltd has a market capitalization of 4,124.00 Cr, categorizing it as a Small Cap company.<BR><BR>Recent Quarterly Performance: The sum of Net Sales for the latest 4 quarters is 570.86 Cr, while the sum of Net Profit for the same period is 95.86 Cr.<BR><BR>Balance Sheet Snapshot: The reporting period for the balance sheet is March 2025. Shareholder's Funds are valued at 405.66 Cr, and Total Assets amount to 507.92 Cr.

View full answer

Who are in the management team of Shivalik Bimetal?

11-Jun-2026

The management team of Shivalik Bimetal includes S S Sandhu (Chairman & Wholetime Director), N S Ghumman (Managing Director), and several directors, including independent directors and the Company Secretary, Aarti Jassal, who oversee the company's operations and strategic direction.

The management team of Shivalik Bimetal includes the following individuals:<BR><BR>1. S S Sandhu - Chairman & Wholetime Director<BR>2. N S Ghumman - Managing Director<BR>3. G S Gill - Director<BR>4. Harpreet Kaur - Director<BR>5. N J S Gill - Independent Director<BR>6. Pradeep Khanna - Independent Director<BR>7. Anu Ahluwalia - Independent Director<BR>8. Swarnjit Singh - Independent Director<BR>9. Sudhir Mehra - Independent Director<BR>10. N P Sahni - Independent Director<BR>11. Aarti Jassal - Company Secretary & Compliance Officer<BR><BR>This team is responsible for overseeing the operations and strategic direction of the company.

View full answer

Who are the peers of the Shivalik Bimetal?

11-Jun-2026

Shivalik Bimetal's peers include Aeroflex, Surya Roshni, Bansal Wire Inds, Goodluck India, Electrost.Cast., Man Industries, Welspun Special., Kalyani Steels, and Sambhv Steel. In terms of management risk and growth, Shivalik Bimetal shows good performance, with a 1-year return of 39.07%, while Aeroflex leads with 144.45% return and Electrost.Cast. has the lowest at -45.12%.

Peers: The peers of Shivalik Bimetal are Aeroflex, Surya Roshni, Bansal Wire Inds, Goodluck India, Electrost.Cast., Man Industries, Welspun Special., Kalyani Steels, and Sambhv Steel.<BR><BR>Quality Snapshot: Excellent management risk is observed at Shivalik Bimetal and Venus Pipes, while Average management risk is found at Aeroflex, Surya Roshni, and Kalyani Steels, and the rest. Good management risk is present at Bansal Wire Inds and Sambhv Steel, while Below Average management risk is noted at Electrost.Cast., Man Industries, and Welspun Special. In terms of growth, Excellent growth is seen at Goodluck India and Venus Pipes, Good growth at Shivalik Bimetal and Welspun Special, Below Average growth at Aeroflex, Surya Roshni, Bansal Wire Inds, Electrost.Cast., Man Industries, and Kalyani Steels, and the rest. <BR><BR>Return Snapshot: The peer with the highest 1-year return is Aeroflex at 144.45%, while the lowest is Electrost.Cast. at -45.12%. Shivalik Bimetal's 1-year return of 39.07% is significantly higher than that of Electrost.Cast. Additionally, peers with negative six-month returns include Surya Roshni and Electrost.Cast.

View full answer

What does Shivalik Bimetal do?

10-Jun-2026

Shivalik Bimetal Controls Ltd, a small-cap company in the Iron & Steel Products industry, was established in 1984 and reported net sales of ₹163 Cr and a net profit of ₹26 Cr for March 2026. Key metrics include a P/E ratio of 43.00, a dividend yield of 0.48%, and a market cap of ₹4,124 Cr.

Overview:<BR>Shivalik Bimetal Controls Ltd operates in the Iron & Steel Products industry and is categorized as a Small Cap company.<BR><BR>History:<BR>The company was incorporated on June 18, 1984, in New Delhi and has been in commercial production since October 1986. The latest quarterly results reported net sales and net profit for March 2026.<BR><BR>Financial Snapshot:<BR>- Net Sales: 163 Cr (Quarterly Results - Mar 2026)<BR>- Net Profit: 26 Cr (Quarterly Results - Mar 2026)<BR>- Market cap: INR 4,124 Cr (Small Cap)<BR><BR>Key Metrics:<BR>- P/E: 43.00<BR>- Industry P/E: 26<BR>- Dividend Yield: 0.48%<BR>- Debt Equity: -0.09<BR>- Return on Equity: 20.06%<BR>- Price to Book: 8.69<BR><BR>Contact Details:<BR>Address: 16-18 New Electronic Complex, Chambaghat Solan Himachal Pradesh : 173213<BR>Tel: 91-1792-230578/230175<BR>Email: investor@shivalikbimetals.com<BR>Website: http://www.shivalikbimetals.com

View full answer

Are Shivalik Bimetal Controls Ltd latest results good or bad?

19-May-2026

Shivalik Bimetal Controls Ltd's latest results are strong, with record quarterly net sales of ₹162.63 crores and a net profit of ₹26.05 crores, showing significant growth year-on-year. However, the stock's high price-to-earnings ratio of 38 times raises concerns about its valuation sustainability.

Shivalik Bimetal Controls Ltd's latest results are quite strong. The company reported its highest-ever quarterly net sales of ₹162.63 crores for Q4 FY26, reflecting a significant 21.16% growth compared to the previous quarter and a 22.80% increase year-on-year. Additionally, the consolidated net profit reached ₹26.05 crores, which is a 17.45% improvement quarter-on-quarter and a 23.75% increase year-on-year.<BR><BR>Despite these positive results, there are some concerns regarding the company's valuation. The stock trades at a high price-to-earnings ratio of 38 times trailing earnings, which is significantly above the industry average of 19 times. This raises questions about the sustainability of the current valuation levels.<BR><BR>Overall, while the financial performance indicates robust demand and operational efficiency, the elevated valuation may warrant caution for potential investors.

View full answer

Has Shivalik Bimetal Controls Ltd declared dividend?

06-Feb-2026

Yes, Shivalik Bimetal Controls Ltd has declared a 100% dividend, amounting to ₹1.5 per share, with an ex-date of February 13, 2026. While recent total returns have shown volatility, the company has experienced substantial growth over the long term, particularly a total return of nearly 995% over the past five years.

Shivalik Bimetal Controls Ltd has declared a dividend.<BR><BR>Dividend Details:<BR>- Percentage announced: 100%<BR>- Amount per share: 1.5<BR>- Ex-date: 13 Feb 26<BR><BR>Dividend Yield: 0.59%<BR><BR>Total Returns by Period:<BR>In the 3-month period, the price return was 2.67%, the dividend return was 0.40%, resulting in a total return of 3.07%.<BR><BR>Over the 6-month period, the price return was -6.92%, the dividend return was 0.69%, leading to a total return of -6.23%.<BR><BR>For the 1-year period, the price return was -8.55%, the dividend return was 0.93%, culminating in a total return of -7.62%.<BR><BR>In the 2-year period, the price return was -16.84%, the dividend return was 1.03%, resulting in a total return of -15.81%.<BR><BR>During the 3-year period, the price return was 23.13%, the dividend return was 1.69%, giving a total return of 24.82%.<BR><BR>Over the 4-year period, the price return was 53.25%, the dividend return was 2.98%, leading to a total return of 56.23%.<BR><BR>In the 5-year period, the price return was 979.2%, the dividend return was 15.74%, resulting in a total return of 994.94%.<BR><BR>Overall, Shivalik Bimetal Controls Ltd has declared a significant dividend, and while recent total returns show volatility, the long-term returns indicate substantial growth, particularly over the 5-year period.

View full answer

Is Shivalik Bimetal technically bullish or bearish?

03-Dec-2025

As of December 2, 2025, Shivalik Bimetal's technical trend has shifted to bearish, indicated by negative MACD readings, bearish moving averages, and a lack of positive signals from the RSI and Dow Theory.

As of 2 December 2025, the technical trend has changed from mildly bearish to bearish. The current technical stance for Shivalik Bimetal is bearish with a strong indication of weakness. Key indicators driving this stance include the bearish MACD readings on both the weekly and monthly time frames, bearish moving averages on the daily chart, and bearish KST across both weekly and monthly periods. Additionally, the Bollinger Bands reflect a mildly bearish sentiment on the weekly and monthly charts, while the OBV shows a mildly bearish trend on the weekly. Overall, the lack of positive signals from the RSI and Dow Theory further supports the bearish outlook.

View full answer

How has been the historical performance of Shivalik Bimetal?

13-Nov-2025

Shivalik Bimetal has shown steady growth in net sales and profitability, with net sales reaching 508.35 crore in March 2025, despite a slight decline from the previous year. The company reported a profit after tax of 75.38 crore for March 2025, down from 80.95 crore in March 2024, while total assets increased to 507.92 crore.

Answer:<BR>The historical performance of Shivalik Bimetal shows a steady growth trajectory in net sales and profitability over the years.<BR><BR>Breakdown:<BR>Shivalik Bimetal's net sales have shown a consistent increase, reaching 508.35 crore in March 2025, slightly down from 508.93 crore in March 2024, but significantly higher than 470.37 crore in March 2023. The total operating income mirrored this trend, with a peak of 508.35 crore in March 2025. The company's total expenditure, excluding depreciation, was 404.63 crore in March 2025, reflecting a modest increase from 402.64 crore in March 2024. Operating profit (PBDIT) was reported at 116.56 crore in March 2025, down from 125.41 crore in the previous year, while profit before tax was 101.03 crore, slightly lower than 108.43 crore in March 2024. The profit after tax for March 2025 was 75.38 crore, a decrease from 80.95 crore in March 2024. Shivalik Bimetal's total assets grew to 507.92 crore in March 2025, up from 442.77 crore in March 2024, with total liabilities also increasing to 507.92 crore. Cash flow from operating activities improved to 93 crore in March 2025, compared to 68 crore in March 2024, contributing to a net cash inflow of 9 crore for the year. Overall, the company has demonstrated resilience and growth in its financial performance over the years.

View full answer

Who are the top shareholders of the Shivalik Bimetal?

17-Jul-2025

The top shareholders of Shivalik Bimetal include O D Finance And Investment Private Limited (15.73%), mutual funds (19.68%), foreign institutional investors (3.63%), and individual investors (34.92%), with Aditya Birla Sun Life Trustee Private Limited being the largest public shareholder at 4.22%.

The top shareholders of Shivalik Bimetal include a mix of institutional and individual investors. The largest promoter is O D Finance And Investment Private Limited, holding 15.73%. Additionally, mutual funds collectively hold 19.68% through 14 schemes, while foreign institutional investors (FIIs) account for 3.63% with 43 FIIs involved. The highest public shareholder is Aditya Birla Sun Life Trustee Private Limited, which holds 4.22% through the Aditya Birla Sun Life Business Cycle Fund. Individual investors represent a significant portion of the ownership, holding 34.92%.

View full answer

Is Shivalik Bimetal overvalued or undervalued?

09-Jun-2025

As of September 20, 2021, Shivalik Bimetal is considered very expensive and overvalued with a PE ratio of 36.50, a Price to Book Value of 6.93, and an EV to EBITDA of 26.67, significantly higher than its peers like JSW Steel and Tata Steel, while also underperforming the Sensex with a year-to-date return of -15.32%.

As of 20 September 2021, Shivalik Bimetal's valuation grade has moved from expensive to very expensive, indicating a significant increase in perceived overvaluation. The company is currently assessed as overvalued, with a PE ratio of 36.50, a Price to Book Value of 6.93, and an EV to EBITDA of 26.67. These ratios suggest that the stock is trading at a premium compared to its earnings and book value.<BR><BR>In comparison to its peers, Shivalik Bimetal's valuation stands out as particularly high; for instance, JSW Steel has a PE ratio of 64.98 and an EV to EBITDA of 14.20, while Tata Steel shows a PE of 51.92 and an EV to EBITDA of 11.04. The disparity in these ratios highlights Shivalik Bimetal's overvaluation within the industry. Additionally, the company's recent stock performance has lagged behind the Sensex, with a year-to-date return of -15.32% compared to the Sensex's 5.62%, further reinforcing the notion of overvaluation.

View full answer

What is the bonus history of the Shivalik Bimetal?

06-Jun-2025

Shivalik Bimetal has issued bonuses twice: a 1:2 bonus on October 12, 2022, and a 1:1 bonus on October 5, 2017, demonstrating its commitment to rewarding shareholders.

Shivalik Bimetal has a history of bonus issues that includes two significant events. The most recent bonus was a 1:2 issue, which was announced with an ex-date of October 12, 2022, and a record date of October 13, 2022. Prior to that, the company issued a 1:1 bonus with an ex-date of October 5, 2017, and a record date of October 6, 2017. This reflects the company's approach to rewarding its shareholders through bonus shares over the years.

View full answer
iScoreScore
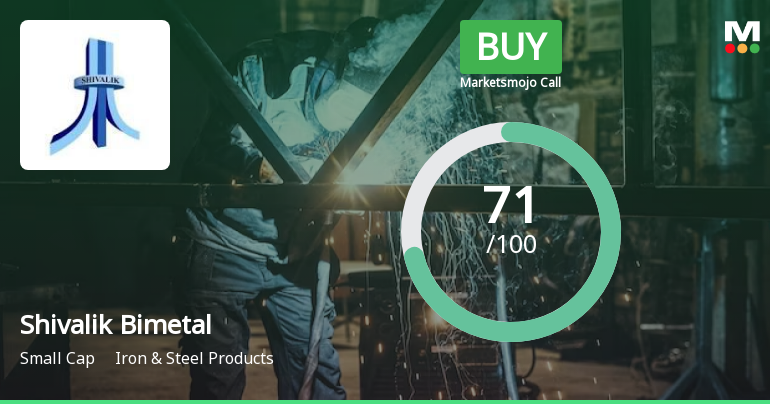
Click here to find our call on this stock
Strong Sell
Sell
Hold
Buy
Strong Buy

Dashboard

1

High Management Efficiency with a high ROE of 24.46%

 
2

Company has a Debt to Equity ratio (avg) of 0.08 times

 
3

Positive results in Jun 26

4

Market Beating performance in long term as well as near term

stock-summaryMojo Parameters

Mojo Parameters

Loading Valuation Snapshot...

Stock DNA

stock-summary
Industry

Iron & Steel Products

stock-summary
Market cap

INR 5,119 Cr (Small Cap)

stock-summary
P/E

50.00

stock-summary
Industry P/E

25

stock-summary
Dividend Yield

0.46%

stock-summary
Debt Equity

-0.09

stock-summary
Return on Equity

20.06%

stock-summary
Price to Book

9.17

Revenue and Profits:
Net Sales:
182 Cr
(Quarterly Results - Jun 2026)
Net Profit:
33 Cr
stock-summaryTotal Returns
Total Returns (Price + Dividend) stock-summary
Dividend Yield (0.46%)
TimePeriod
Price Return
Dividend Return
Total Return
3 Months
47.89%
0%
47.89%
6 Months
89.86%
0.39%
90.25%
1 Year
76.68%
0.70%
77.38%
2 Years
67.26%
0.94%
68.2%
3 Years
57.58%
1.27%
58.85%
4 Years
209.22%
1.90%
211.12%
5 Years
668.8%
6.79%
675.59%

Latest dividend: 2 per share ex-dividend date: Feb-13-2026

Risk Adjusted Returns v/s stock-summary
Returns Beta
Icon
Beta has not been calculated since enough price history is not available
stock-summaryNews & Corporate Actions

Announcements stock-summary

Announcement under Regulation 30 (LODR)-Analyst / Investor Meet - Intimation

04-Aug-2026 | Source : BSE

Intimation of Earnings call invitation - Q1 & FY2027

Board Meeting Intimation for Unaudited Standalone And Consolidated Financial Results For The Quarter Ended June 30 2026

30-Jul-2026 | Source : BSE

Shivalik Bimetal Controls Ltdhas informed BSE that the meeting of the Board of Directors of the Company is scheduled on 06/08/2026 inter alia to consider and approve the a) unaudited standalone and consolidated financial results for the quarter ended June 30 2026. b) Fixation of the date time venue and mode of 42nd Annual General meeting

Announcement under Regulation 30 (LODR)-Newspaper Publication

18-Jul-2026 | Source : BSE

Newspaper Publication - Transfer of shares into Investor Education and Protection Fund and Special Window for re-lodgement of Transfer and dematerialisation of physical shares

Corporate Actions stock-summary

stock-summary
BOARD MEETING

No Upcoming Board Meetings

stock-summary
DIVIDEND

Shivalik Bimetal Controls Ltd has declared 100% dividend, ex-date: 13 Feb 26

stock-summary
SPLITS

No Splits history available

stock-summary
BONUS

Shivalik Bimetal Controls Ltd has announced 1:2 bonus issue, ex-date: 12 Oct 22

stock-summary
RIGHTS

No Rights history available

stock-summaryKey Factors

Quality key factors stock-summary

Factor
Value
Sales Growth (5y)
22.89%
EBIT Growth (5y)
31.06%
EBIT to Interest (avg)
21.11
Debt to EBITDA (avg)
0.52
Net Debt to Equity (avg)
-0.09
Sales to Capital Employed (avg)
1.27
Tax Ratio
24.42%
Dividend Payout Ratio
20.18%
Pledged Shares
0
Institutional Holding
16.59%
ROCE (avg)
28.05%
ROE (avg)
24.46%

Valuation key factors

Factor
Value
P/E Ratio
50
Industry P/E
25
Price to Book Value
11.01
EV to EBIT
41.23
EV to EBITDA
37.02
EV to Capital Employed
12.02
EV to Sales
8.53
PEG Ratio
1.66
Dividend Yield
0.38%
ROCE (Latest)
26.74%
ROE (Latest)
20.06%

Technicals key factors

Indicator
Weekly
Monthly
MACD
Bullish
Bullish
RSI
Bearish
Bearish
Bollinger Bands
Bullish
Bullish
Moving Averages
Bullish (Daily)
KST
Bullish
Bullish
Dow Theory
Bullish
Bullish
OBV
Mildly Bullish
No Trend
stock-summary Technical Indicator Scale: Bearish, Mildly Bearish, Sideways, Mildly Bullish, Bullish  Turned 
stock-summaryShareholding
Shareholding Snapshot : Jun 2026stock-summary
Shareholding Compare (%holding) stock-summary
Majority shareholders

Non Institution

Pledged Promoter Holdings

None

Mutual Funds

Held by 8 Schemes (9.81%)

FIIs

Held by 41 FIIs (2.04%)

Promoter with highest holding

O D Finance And Investment Private Limited (15.73%)

Highest Public shareholder

Aditya Birla Sun Life Trustee Private Limite A/c Aditya Birla Sun Life Business Cycle Fund (3.76%)

Individual Investors Holdings

42.09%

stock-summaryFinancial
[
  {
    "link": "quarterly",
    "btn_text": "All Quarterly Results",
    "header": "Quarterly Results Snapshot (Consolidated) - Jun'26 - QoQ",
    "rhs": [
      {
        "prefix": "Net Sales ",
        "suffix": "QoQ Growth in quarter ended Jun 2026 is 12.03% vs 21.16% in Mar 2026",
        "dir": -1
      },
      {
        "prefix": "Consolidated Net Profit ",
        "suffix": "QoQ Growth in quarter ended Jun 2026 is 26.72% vs 17.45% in Mar 2026",
        "dir": 1
      }
    ],
    "table": {
      "header": [
        "Jun'26",
        "Mar'26",
        "Change(%)"
      ],
      "body": [
        {
          "field": "Net Sales",
          "val1": "182.20",
          "val2": "162.63",
          "chgp": "12.03%",
          "chgp_class": "positive"
        },
        {
          "field": "Operating Profit (PBDIT) excl Other Income",
          "val1": "43.22",
          "val2": "35.47",
          "chgp": "21.85%",
          "chgp_class": "positive"
        },
        {
          "field": "Interest",
          "val1": "1.30",
          "val2": "1.20",
          "chgp": "8.33%",
          "chgp_class": "negative"
        },
        {
          "field": "Exceptional Items",
          "val1": "0.26",
          "val2": "0.00",
          "chgp": "",
          "chgp_class": "neutral"
        },
        {
          "field": "Consolidate Net Profit",
          "val1": "33.01",
          "val2": "26.05",
          "chgp": "26.72%",
          "chgp_class": "positive"
        },
        {
          "field": "Operating Profit Margin (Excl OI)",
          "val1": "23.72%",
          "val2": "21.81%",
          "chgp": "1.91%",
          "chgp_class": "positive"
        }
      ]
    }
  },
  {
    "link": "half-yearly",
    "btn_text": "All Half Yearly Results",
    "header": "Half Yearly Results Snapshot (Consolidated) - Sep'25",
    "rhs": [
      {
        "prefix": "Net Sales ",
        "suffix": " Growth in half year ended Sep 2025 is 8.46% vs -0.91% in Sep 2024",
        "dir": 1
      },
      {
        "prefix": "Consolidated Net Profit ",
        "suffix": " Growth in half year ended Sep 2025 is 26.14% vs -9.27% in Sep 2024",
        "dir": 1
      }
    ],
    "table": {
      "header": [
        "Sep'25",
        "Sep'24",
        "Change(%)"
      ],
      "body": [
        {
          "field": "Net Sales",
          "val1": "274.00",
          "val2": "252.63",
          "chgp": "8.46%",
          "chgp_class": "positive"
        },
        {
          "field": "Operating Profit (PBDIT) excl Other Income",
          "val1": "63.03",
          "val2": "50.66",
          "chgp": "24.42%",
          "chgp_class": "positive"
        },
        {
          "field": "Interest",
          "val1": "2.16",
          "val2": "1.81",
          "chgp": "19.34%",
          "chgp_class": "negative"
        },
        {
          "field": "Exceptional Items",
          "val1": "0.00",
          "val2": "0.00",
          "chgp": "",
          "chgp_class": "neutral"
        },
        {
          "field": "Consolidate Net Profit",
          "val1": "47.63",
          "val2": "37.76",
          "chgp": "26.14%",
          "chgp_class": "positive"
        },
        {
          "field": "Operating Profit Margin (Excl OI)",
          "val1": "23.00%",
          "val2": "20.05%",
          "chgp": "2.95%",
          "chgp_class": "positive"
        }
      ]
    }
  },
  {
    "link": "nine-monthly",
    "btn_text": "All Nine Monthly Results",
    "header": "Nine Monthly Results Snapshot (Consolidated) - Dec'25",
    "rhs": [
      {
        "prefix": "Net Sales ",
        "suffix": "YoY Growth in nine months ended Dec 2025 is 8.60% vs -1.38% in Dec 2024",
        "dir": 1
      },
      {
        "prefix": "Consolidated Net Profit ",
        "suffix": "YoY Growth in nine months ended Dec 2025 is 24.66% vs -4.40% in Dec 2024",
        "dir": 1
      }
    ],
    "table": {
      "header": [
        "Dec'25",
        "Dec'24",
        "Change(%)"
      ],
      "body": [
        {
          "field": "Net Sales",
          "val1": "408.23",
          "val2": "375.91",
          "chgp": "8.60%",
          "chgp_class": "positive"
        },
        {
          "field": "Operating Profit (PBDIT) excl Other Income",
          "val1": "95.26",
          "val2": "75.21",
          "chgp": "26.66%",
          "chgp_class": "positive"
        },
        {
          "field": "Interest",
          "val1": "3.49",
          "val2": "2.67",
          "chgp": "30.71%",
          "chgp_class": "negative"
        },
        {
          "field": "Exceptional Items",
          "val1": "-0.92",
          "val2": "0.00",
          "chgp": "",
          "chgp_class": "neutral"
        },
        {
          "field": "Consolidate Net Profit",
          "val1": "69.81",
          "val2": "56.00",
          "chgp": "24.66%",
          "chgp_class": "positive"
        },
        {
          "field": "Operating Profit Margin (Excl OI)",
          "val1": "23.33%",
          "val2": "20.01%",
          "chgp": "3.32%",
          "chgp_class": "positive"
        }
      ]
    }
  },
  {
    "link": "annual",
    "btn_text": "All Annual Results",
    "header": "Annual Results Snapshot (Consolidated) - Mar'26",
    "rhs": [
      {
        "prefix": "Net Sales ",
        "suffix": "YoY Growth in year ended Mar 2026 is 12.30% vs -0.11% in Mar 2025",
        "dir": 1
      },
      {
        "prefix": "Consolidated Net Profit ",
        "suffix": "YoY Growth in year ended Mar 2026 is 24.40% vs -8.56% in Mar 2025",
        "dir": 1
      }
    ],
    "table": {
      "header": [
        "Mar'26",
        "Mar'25",
        "Change(%)"
      ],
      "body": [
        {
          "field": "Net Sales",
          "val1": "570.86",
          "val2": "508.35",
          "chgp": "12.30%",
          "chgp_class": "positive"
        },
        {
          "field": "Operating Profit (PBDIT) excl Other Income",
          "val1": "130.72",
          "val2": "103.72",
          "chgp": "26.03%",
          "chgp_class": "positive"
        },
        {
          "field": "Interest",
          "val1": "4.69",
          "val2": "3.75",
          "chgp": "25.07%",
          "chgp_class": "negative"
        },
        {
          "field": "Exceptional Items",
          "val1": "-0.92",
          "val2": "0.00",
          "chgp": "",
          "chgp_class": "neutral"
        },
        {
          "field": "Consolidate Net Profit",
          "val1": "95.86",
          "val2": "77.06",
          "chgp": "24.40%",
          "chgp_class": "positive"
        },
        {
          "field": "Operating Profit Margin (Excl OI)",
          "val1": "22.90%",
          "val2": "20.40%",
          "chgp": "2.50%",
          "chgp_class": "positive"
        }
      ]
    }
  }
]

Quarterly Results Snapshot (Consolidated) - Jun'26 - QoQstock-summary

Jun'26
Mar'26
Change(%)
Net Sales
182.20
162.63
12.03%
Operating Profit (PBDIT) excl Other Income
43.22
35.47
21.85%
Interest
1.30
1.20
8.33%
Exceptional Items
0.26
0.00
Consolidate Net Profit
33.01
26.05
26.72%
Operating Profit Margin (Excl OI)
23.72%
21.81%
1.91%
Values in Rs Cr.
Direction Arrows
Net Sales

QoQ Growth in quarter ended Jun 2026 is 12.03% vs 21.16% in Mar 2026

Direction Arrows
Consolidated Net Profit

QoQ Growth in quarter ended Jun 2026 is 26.72% vs 17.45% in Mar 2026

Half Yearly Results Snapshot (Consolidated) - Sep'25stock-summary

Sep'25
Sep'24
Change(%)
Net Sales
274.00
252.63
8.46%
Operating Profit (PBDIT) excl Other Income
63.03
50.66
24.42%
Interest
2.16
1.81
19.34%
Exceptional Items
0.00
0.00
Consolidate Net Profit
47.63
37.76
26.14%
Operating Profit Margin (Excl OI)
23.00%
20.05%
2.95%
Values in Rs Cr.
Direction Arrows
Net Sales

Growth in half year ended Sep 2025 is 8.46% vs -0.91% in Sep 2024

Direction Arrows
Consolidated Net Profit

Growth in half year ended Sep 2025 is 26.14% vs -9.27% in Sep 2024

Nine Monthly Results Snapshot (Consolidated) - Dec'25stock-summary

Dec'25
Dec'24
Change(%)
Net Sales
408.23
375.91
8.60%
Operating Profit (PBDIT) excl Other Income
95.26
75.21
26.66%
Interest
3.49
2.67
30.71%
Exceptional Items
-0.92
0.00
Consolidate Net Profit
69.81
56.00
24.66%
Operating Profit Margin (Excl OI)
23.33%
20.01%
3.32%
Values in Rs Cr.
Direction Arrows
Net Sales

YoY Growth in nine months ended Dec 2025 is 8.60% vs -1.38% in Dec 2024

Direction Arrows
Consolidated Net Profit

YoY Growth in nine months ended Dec 2025 is 24.66% vs -4.40% in Dec 2024

Annual Results Snapshot (Consolidated) - Mar'26stock-summary

Mar'26
Mar'25
Change(%)
Net Sales
570.86
508.35
12.30%
Operating Profit (PBDIT) excl Other Income
130.72
103.72
26.03%
Interest
4.69
3.75
25.07%
Exceptional Items
-0.92
0.00
Consolidate Net Profit
95.86
77.06
24.40%
Operating Profit Margin (Excl OI)
22.90%
20.40%
2.50%
Values in Rs Cr.
Direction Arrows
Net Sales

YoY Growth in year ended Mar 2026 is 12.30% vs -0.11% in Mar 2025

Direction Arrows
Consolidated Net Profit

YoY Growth in year ended Mar 2026 is 24.40% vs -8.56% in Mar 2025

stock-summaryCompany CV
About Shivalik Bimetal Controls Ltd stock-summary
stock-summary
Shivalik Bimetal Controls Ltd
Small Cap
Iron & Steel Products
Shivalik Bimetal Controls Limited was incorporated on June 18, 1984 in New Delhi. Company has been in commercial production since October, 1986, promoted by Manjit Kaur and Narinder Singh Ghumman.
Company Coordinates stock-summary
Company Details
16-18 New Electronic Complex, Chambaghat Solan Himachal Pradesh : 173213
stock-summary
Tel: 91-1792-230578/230175
stock-summary
investor@shivalikbimetals.com
Registrar Details
MAS Services Ltd, T-34 , 2nd Floor, Okhla Industrial Area, Phase - II, New Delhi