
Compare Aeroflex with Similar Stocks
Dashboard
The company is Net-Debt Free
Poor long term growth as Operating profit has grown by an annual rate 15.15% of over the last 5 years
Positive results in Mar 26
With ROE of 13.3, it has a Very Expensive valuation with a 17.3 Price to Book Value
Increasing Participation by Institutional Investors
Market Beating Performance
Stock DNA
Iron & Steel Products
INR 6,337 Cr (Small Cap)
112.00
26
0.06%
-0.05
13.29%
17.33
Total Returns (Price + Dividend) 
Latest dividend: 0.3 per share ex-dividend date: Jul-29-2025
Risk Adjusted Returns v/s
Returns Beta

News
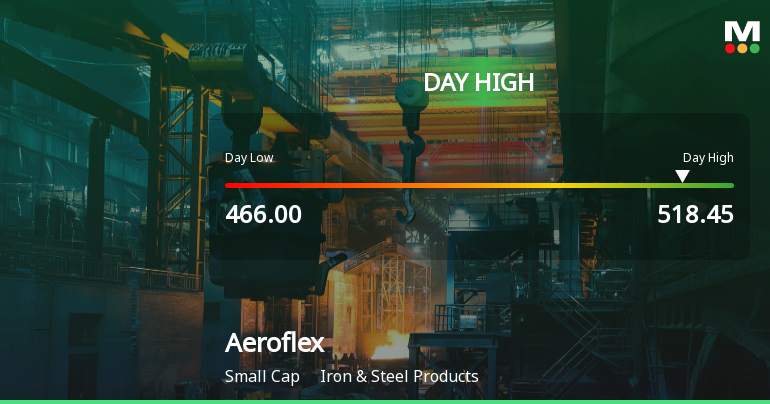
Aeroflex Industries Ltd Surges 8.88% to Day's High of Rs 511.7 — Outperforms Sector by 7.81 Percentage Points
The Sensex edged up 0.3% on 17 Jun 2026, but Aeroflex Industries Ltd surged 8.88%, outpacing its Iron & Steel Products sector by 7.81 percentage points. This sharp single-session gain rewrites the short-term narrative for the small-cap stock, which also hit a new 52-week and all-time high of Rs 511.7 during the day.
Read full news article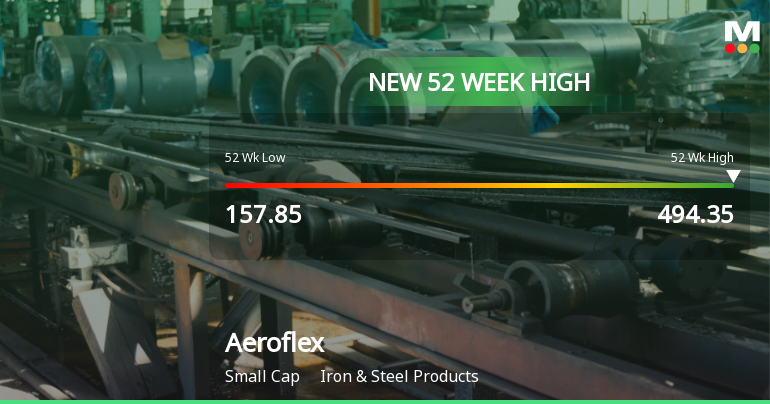
Aeroflex Industries Ltd Hits New 52-Week High of Rs 494.35 on Back of Strong Technical Signals
From Rs 157.85 to Rs 494.35 — Aeroflex Industries Ltd has surged by an impressive 194.3% over the past year, culminating in a fresh 52-week high on 17 Jun 2026. This remarkable rally is underpinned by a broad alignment of technical indicators signalling sustained momentum.
Read full news article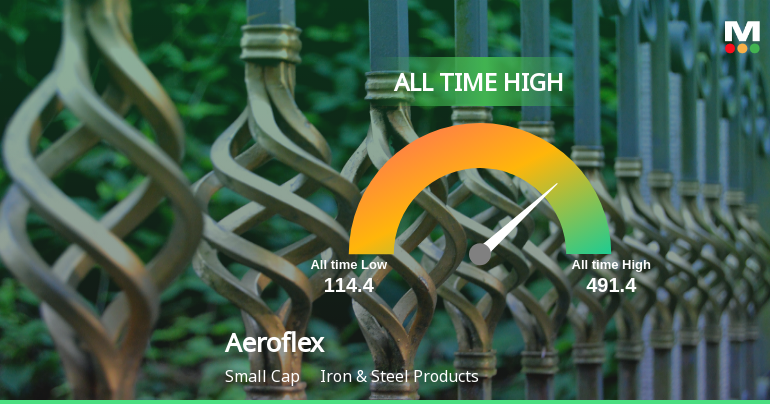
Aeroflex Industries Ltd Hits All-Time High of Rs 493.40 as Momentum Builds Across Timeframes
Extending a remarkable rally that has seen it nearly triple in value over the past year, Aeroflex Industries Ltd touched a fresh all-time high of Rs 493.40 on 17 Jun 2026, closing just 0.41% above its previous 52-week peak. This surge outpaced the Sensex by a wide margin, underscoring the stock’s strong momentum across multiple timeframes.
Read full news article Announcements
Announcement under Regulation 30 (LODR)-Analyst / Investor Meet - Intimation
21-May-2026 | Source : BSEAeroflex Industries Limited has informed the Exchange about Schedule of Meet.
Compliances-Reg.24(A)-Annual Secretarial Compliance
20-May-2026 | Source : BSEAnnual Secretarial Compliance Report for the financial year ended 31st March 2026.
Announcement under Regulation 30 (LODR)-Analyst / Investor Meet - Intimation
11-May-2026 | Source : BSEIntimation of Schedule of Group Investors/Analysts Meeting
Corporate Actions

No Upcoming Board Meetings

Aeroflex Industries Ltd has declared 15% dividend, ex-date: 29 Jul 25

No Splits history available

No Bonus history available

No Rights history available
Quality key factors
Valuation key factors
Technicals key factors
 Technical Indicator Scale: Bearish, Mildly Bearish, Sideways, Mildly Bullish, Bullish Turned
 Shareholding Snapshot : Mar 2026
Shareholding Compare (%holding)
Promoters
None
Held by 2 Schemes (2.12%)
Held by 20 FIIs (1.49%)
Aeroflex Enterprises Limited (59.84%)
Ashish Kacholia (2.27%)
22.34%
Quarterly Results Snapshot (Consolidated) - Mar'26 - QoQ

QoQ Growth in quarter ended Mar 2026 is 4.09% vs 9.04% in Dec 2025
QoQ Growth in quarter ended Mar 2026 is 6.97% vs 15.88% in Dec 2025
Half Yearly Results Snapshot (Consolidated) - Sep'25
Growth in half year ended Sep 2025 is 5.67% vs 10.62% in Sep 2024
Growth in half year ended Sep 2025 is -17.91% vs 15.05% in Sep 2024
Nine Monthly Results Snapshot (Consolidated) - Dec'25
YoY Growth in nine months ended Dec 2025 is 11.09% vs 18.49% in Dec 2024
YoY Growth in nine months ended Dec 2025 is -8.21% vs 30.22% in Dec 2024
Annual Results Snapshot (Consolidated) - Mar'26
YoY Growth in year ended Mar 2026 is 17.47% vs 18.34% in Mar 2025
YoY Growth in year ended Mar 2026 is 5.75% vs 25.83% in Mar 2025
About Aeroflex Industries Ltd

Company Coordinates


