Surya Roshni

  • Market Cap: Small Cap
  • Industry: Iron & Steel Products
  • ISIN: INE335A01020
  • NSEID: SURYAROSNI
  • BSEID: 500336
INR
258.30
-3.7 (-1.41%)
BSENSE

Dec 05

BSE+NSE Vol: 1.21 lacs

  • Price Points
  • Score
  • Mojo Parameters
  • Total Return
  • News and Corporate Actions
  • Key factors
  • Shareholding
  • Financials
  • CompanyCV
stock-summaryPrice Point
High/Low

1Day

52 Week

Valuation
Technical
Day's Volume

CASH

1.21 lacs (0.40%) Volume

Shareholding (Sep 2025)

FII

4.95%

Held by 123 FIIs

DII

1.07%

Held by 3 DIIs

Promoter

62.47%

how big is Surya Roshni?

06-Jun-2025

As of Jun 06, Surya Roshni Ltd has a market capitalization of 7,312.57 Cr, with recent net sales of 7,435.87 Cr and a net profit of 346.60 Cr over the last four quarters. Shareholder's funds are 2,166.39 Cr, and total assets amount to 2,921.73 Cr as of Mar'24.

Market Cap: As of Jun 06, Surya Roshni Ltd has a market capitalization of 7,312.57 Cr, categorizing it as a Mid Cap company.<BR><BR>Recent Quarterly Performance: The sum of Net Sales for the latest 4 quarters is 7,435.87 Cr, and the sum of Net Profit for the same period is 346.60 Cr. This data is Consolidated.<BR><BR>Balance Sheet Snapshot: This is Consolidated data for the latest annual period ending in Mar'24. Shareholder's Funds are reported at 2,166.39 Cr, and Total Assets amount to 2,921.73 Cr.

Read More

Who are the top shareholders of the Surya Roshni?

06-Jun-2025

The top shareholders of Surya Roshni include Diwakar Marketing Private Limited as the largest promoter with 10.36%, followed by Henco Commercials Private Limited at 2.36%, individual investors with 21.72%, and 115 Foreign Institutional Investors holding 4.12%. There are no pledged promoter holdings reported.

The top shareholders of Surya Roshni include a mix of promoters, institutional investors, and individual shareholders. The majority of the shares are held by promoters, with Diwakar Marketing Private Limited being the largest promoter with a holding of 10.36%. <BR><BR>In terms of public shareholders, Henco Commercials Private Limited holds 2.36%. Additionally, individual investors collectively own 21.72% of the company. The company also has 7 mutual fund schemes holding a total of 0.64% and 115 Foreign Institutional Investors (FIIs) holding 4.12%. There are no pledged promoter holdings reported.

Read More

When is the next results date for Surya Roshni?

06-Jun-2025

No Upcoming Board Meetings

What is the bonus history of the Surya Roshni?

06-Jun-2025

Surya Roshni has announced a 1:1 bonus issue, with an ex-date and record date set for January 1, 2025. Shareholders will receive one additional share for each share held.

Surya Roshni has a recent bonus issue history where it announced a 1:1 bonus issue. The ex-date for this bonus is set for January 1, 2025. This means that for every share held, shareholders will receive an additional share. The record date for this bonus issue is also January 1, 2025. If you have any more questions about Surya Roshni or need further details, feel free to ask!

Read More

Who are the peers of the Surya Roshni?

03-Jun-2025

Surya Roshni's peers include APL Apollo Tubes, Welspun Corp, Shyam Metalics, Ratnamani Metals, Jindal Saw, Technocraf.Inds., Electrost.Cast., Bansal Wire Inds, Jayaswal Neco, and Kalyani Steels. In terms of management risk, growth, and capital structure, APL Apollo Tubes stands out positively, while Surya Roshni shows average performance across these metrics.

Peers: The peers of Surya Roshni are APL Apollo Tubes, Welspun Corp, Shyam Metalics, Ratnamani Metals, Jindal Saw, Technocraf.Inds., Electrost.Cast., Bansal Wire Inds, Jayaswal Neco, and Kalyani Steels.<BR><BR>Quality Snapshot: Excellent management risk is observed at APL Apollo Tubes, while Good management risk is found at Welspun Corp, Shyam Metalics, Ratnamani Metals, and Technocraf.Inds. Average management risk is present at Jindal Saw, Surya Roshni, Kalyani Steels, and Electrost.Cast., while Below Average management risk is noted at Jayaswal Neco. For Growth, Excellent growth is seen at APL Apollo Tubes and Jindal Saw, while Average growth is found at Shyam Metalics and Ratnamani Metals, and Below Average growth is noted at Welspun Corp, Surya Roshni, Technocraf.Inds., Bansal Wire Inds, and Kalyani Steels. Lastly, Excellent capital structure is observed at APL Apollo Tubes, Shyam Metalics, Ratnamani Metals, and Surya Roshni, while Good capital structure is found at Welspun Corp and Technocraf.Inds., and Below Average capital structure is noted at Jindal Saw, Electrost.Cast., Bansal Wire Inds, Jayaswal Neco, and Kalyani Steels.<BR><BR>Return Snapshot: The peer with the highest 1-year return is Welspun Corp at 68.56%, while the lowest is Electrost.Cast. at -36.14%. Surya Roshni's 1-year return of 12.02% is significantly lower than that of Welspun Corp but higher than Electrost.Cast. Additionally, the six-month return is negative for Ratnamani Metals, Jindal Saw, Electrost.Cast., Bansal Wire Inds, and Kalyani Steels.

Read More

Who are in the management team of Surya Roshni?

16-Jul-2025

As of March 2022, the management team of Surya Roshni includes J P Agarwal (Chairman & Executive Director), Raju Bista and Vinay Surya (Managing Directors), along with several independent directors, ensuring a diverse governance structure.

As of March 2022, the management team of Surya Roshni includes:<BR><BR>1. J P Agarwal - Chairman & Executive Director<BR>2. Raju Bista - Managing Director<BR>3. Vinay Surya - Managing Director<BR>4. K N Karmarkar - Executive Director<BR>5. Urmil Agarwal - Independent Director<BR>6. T S Bhattacharya - Independent Director<BR>7. Surender Singh Khurana - Independent Director<BR>8. Sunil Sikka - Independent Director<BR>9. Suruchi Aggarwal - Independent Director<BR>10. Tekan Ghanshyam Keswani - Independent Director<BR>11. Naresh Agarwal - Independent Director<BR>12. Sudhanshu Kumar Awasthi - Independent Director<BR><BR>This team comprises a mix of executive and independent directors, reflecting a diverse governance structure.

Read More

What does Surya Roshni do?

17-Jul-2025

Surya Roshni Ltd is a mid-cap manufacturer of steel pipes, lighting products, PVC pipes, and consumer durables, established in 1973. As of March 2025, it reported net sales of ₹21,458 Cr and a net profit of ₹1,301 Cr.

Overview: <BR>Surya Roshni Ltd is a manufacturer of steel pipes and has diversified into lighting, PVC pipes, and consumer durables, operating within the Iron & Steel Products industry as a mid-cap company.<BR><BR>History: <BR>Surya Roshni Ltd was established in 1973, originally known as Prakash Tubes Limited. The company has undergone diversification, entering the lighting market in 1984, PVC pipes in 2010, and consumer durables in 2014-15. The latest quarterly results reported net sales and profit for March 2025.<BR><BR>Financial Snapshot: <BR>- Net Sales: 21,458 Cr (Quarterly Results - Mar 2025) <BR>- Net Profit: 1,301 Cr (Quarterly Results - Mar 2025) <BR>- Market Cap: INR 6,983 Cr (Mid Cap) <BR><BR>Key Metrics: <BR>- P/E: 21.00 <BR>- Industry P/E: 34 <BR>- Dividend Yield: 0.78% <BR>- Debt-Equity: -0.11 <BR>- Return on Equity: 14.06% <BR>- Price to Book: 2.81 <BR><BR>Contact Details: <BR>Address: Prakash Nagar Sankhol, Bahadurgarh Haryana: 124507 <BR>Tel: 01276-241540 <BR>Email: surya@suryasteelpipe.com <BR>Website: http://www.surya.co.in

Read More

Are Surya Roshni latest results good or bad?

12-Nov-2025

Surya Roshni's latest Q2 FY26 results show strong profit growth of 120.61% and a 15% revenue increase, but operating margins remain low at 6.41%, raising concerns about sustainability. Additionally, the stock has underperformed the market, declining nearly 12% over the past year, suggesting caution for investors.

Surya Roshni's latest results for Q2 FY26 show a mixed picture. On the positive side, the company reported a net profit of ₹74.19 crores, which is a remarkable increase of 120.61% compared to the previous quarter. Additionally, revenue grew by 15% quarter-on-quarter and 20.69% year-on-year, indicating strong demand, particularly in the steel pipes and lighting segments.<BR><BR>However, there are concerns regarding the operating margin, which stands at 6.41%. While this is an improvement from the previous quarter's 4.35%, it is significantly lower than the 9.43% achieved in Q4 FY25. This margin compression suggests ongoing pressures in the competitive landscape and rising raw material costs.<BR><BR>Furthermore, despite the strong quarterly performance, Surya Roshni's stock has underperformed the broader market and its sector peers over the past year, declining nearly 12%. This underperformance raises questions about the sustainability of the recent profit improvements and overall growth trajectory.<BR><BR>In summary, while the quarterly results show strong profit growth and revenue increases, the ongoing margin pressures and stock performance relative to peers indicate that investors should remain cautious.

Read More

Has Surya Roshni declared dividend?

13-Nov-2025

Yes, Surya Roshni Ltd has declared a 50% dividend, with an ex-date of November 17, 2025. While recent short-term returns have been negative, longer-term returns over multiple years show substantial growth.

Surya Roshni Ltd has declared a 50% dividend.<BR><BR>Dividend Details:<BR>- Percentage announced: 50%<BR>- Ex-date: 17 Nov 25<BR><BR>Dividend Yield: 1.52%.<BR><BR>Total Returns by Period:<BR>In the last 3 months, the price return was -8.46%, the dividend return was 2.04%, resulting in a total return of -6.42%.<BR><BR>Over the past 6 months, the price return was -2.55%, the dividend return was 1.87%, leading to a total return of -0.68%.<BR><BR>In the 1-year period, the price return was -16.7%, the dividend return was 2.89%, culminating in a total return of -13.81%.<BR><BR>For the 2-year period, the price return was 9.67%, the dividend return was 4.18%, resulting in a total return of 13.85%.<BR><BR>In the last 3 years, the price return was 136.65%, the dividend return was 17.04%, leading to a total return of 153.69%.<BR><BR>Over the 4-year period, the price return was 73.51%, the dividend return was 15.54%, culminating in a total return of 89.05%.<BR><BR>In the 5-year span, the price return was 335.51%, the dividend return was 30.25%, resulting in a total return of 365.76%.<BR><BR>Overall, Surya Roshni Ltd has declared a significant dividend, and while recent short-term returns have been negative, the longer-term returns over multiple years show substantial growth, indicating a positive trend in total returns despite recent fluctuations.

Read More

How has been the historical performance of Surya Roshni?

17-Nov-2025

Surya Roshni's historical performance shows fluctuating net sales, peaking at 7,996.71 Cr in Mar'23 and declining to 7,435.87 Cr by Mar'25, while profitability improved with profit after tax rising to 346.60 Cr. The company maintained a strong balance sheet with low debt and total assets increasing to 3,233.74 Cr in Mar'25.

Answer:<BR>The historical performance of Surya Roshni shows a fluctuating trend in net sales and profits over the years, with a notable increase in recent years.<BR><BR>Breakdown:<BR>Surya Roshni's net sales peaked at 7,996.71 Cr in Mar'23 but saw a decline to 7,435.87 Cr by Mar'25. Despite this drop in sales, the total operating income followed a similar trend, decreasing from 7,996.71 Cr in Mar'23 to 7,435.87 Cr in Mar'25. The total expenditure, excluding depreciation, also decreased to 6,856.66 Cr in Mar'25 from 7,382.55 Cr in Mar'23, contributing to an operating profit of 608.89 Cr in Mar'25, slightly lower than the previous year. Profit before tax improved to 465.41 Cr in Mar'25, up from 459.25 Cr in Mar'23, while profit after tax also increased to 346.60 Cr from 335.52 Cr in the same period. The company's total assets rose to 3,233.74 Cr in Mar'25 from 2,921.73 Cr in Mar'24, reflecting a strengthening balance sheet. However, total debt remained low at 3.08 Cr in Mar'25, down from 403.94 Cr in Mar'23, indicating improved financial stability. Cash flow from operating activities decreased to 394 Cr in Mar'25 from 546 Cr in Mar'24, resulting in a net cash outflow of 15 Cr in Mar'25. Overall, while Surya Roshni faced challenges in sales, it demonstrated resilience in profitability and maintained a solid financial position.

Read More

Is Surya Roshni overvalued or undervalued?

18-Nov-2025

As of November 17, 2025, Surya Roshni is considered very expensive and overvalued with a PE ratio of 18.11, significantly higher than its peers like JSW Steel and Tata Steel, and has underperformed the Sensex with a year-to-date return of -8.17%.

As of 17 November 2025, the valuation grade for Surya Roshni has moved from expensive to very expensive, indicating a significant shift in its market perception. The company is currently deemed overvalued. Key ratios include a PE ratio of 18.11, an EV to EBITDA of 10.30, and a PEG ratio of 8.09, which suggest that the stock is priced at a premium compared to its earnings growth potential.<BR><BR>In comparison to peers, JSW Steel is rated as fair with a PE ratio of 46.87, while Tata Steel is considered attractive with a PE of 29.08. These comparisons highlight that Surya Roshni's valuation is not justified when looking at its peers, as it is trading at a higher valuation despite lower growth prospects. Additionally, the company's recent stock performance has lagged behind the Sensex, with a year-to-date return of -8.17% compared to the Sensex's 8.72%, further reinforcing the notion that it may be overvalued.

Read More

Should I buy, sell or hold Surya Roshni?

19-Nov-2025

Is Surya Roshni technically bullish or bearish?

19-Nov-2025

As of November 18, 2025, Surya Roshni's technical trend has shifted to a moderate bearish stance, supported by bearish indicators from the MACD, Bollinger Bands, and moving averages, along with significant underperformance against the Sensex.

As of 18 November 2025, the technical trend for Surya Roshni has changed from mildly bearish to bearish. The current stance is bearish with a moderate strength. Key indicators driving this conclusion include the weekly MACD and Bollinger Bands both indicating bearish conditions, along with daily moving averages confirming a bearish trend. The KST is bearish on the weekly timeframe and mildly bearish on the monthly, while the Dow Theory also reflects a mildly bearish stance on both weekly and monthly charts. The stock has underperformed significantly against the Sensex over multiple time frames, further supporting the bearish outlook.

Read More

Why is Surya Roshni falling/rising?

04-Dec-2025

As of 04-Dec, Surya Roshni Ltd's stock price is declining, currently at 261.55, with a significant drop of 13.74% over the past month and negative returns of 8.72% over the past year. The stock is underperforming the market, facing challenges in growth and investor confidence, contributing to its bearish trend.

As of 04-Dec, Surya Roshni Ltd's stock price is falling, currently at 261.55, reflecting a decrease of 1.6 points or 0.61%. The stock has underperformed the sector today by 0.54% and is trading below its 5-day, 20-day, 50-day, 100-day, and 200-day moving averages, indicating a bearish trend. <BR><BR>Over the past month, the stock has seen a significant decline of 13.74%, while the benchmark Sensex has risen by 2.16%. Year-to-date, Surya Roshni's stock is down 11.94%, contrasting sharply with the Sensex's gain of 9.12%. This underperformance is further highlighted by the fact that the stock has generated negative returns of 8.72% over the past year, while the broader market has yielded positive returns of 5.32%.<BR><BR>Additionally, there has been a notable decline in investor participation, with delivery volume falling by 35.48% compared to the 5-day average. This suggests a lack of confidence among investors. The company's financial metrics also indicate challenges; despite a low Debt to EBITDA ratio of 0.61, which shows a strong ability to service debt, the long-term growth prospects appear poor, with net sales growing at an annual rate of only 8.35% over the last five years. <BR><BR>Moreover, the company's recent financial results have shown flat performance, with a return on capital employed (ROCE) at a low of 17.67% and a profit before tax (PBT) that has decreased by 12.7% compared to the previous four-quarter average. The stock is also considered expensive, trading at a price-to-book value of 2.3, which is above its peers' average historical valuations. <BR><BR>The combination of these factors—poor long-term growth, underperformance relative to the market, declining investor interest, and high valuation—contributes to the current downward trend in Surya Roshni's stock price.

Read More
iScoreScore
Click here to find our call on this stock
Strong Sell
Sell
Hold
Buy
Strong Buy

MarketsMojo — Loved in India, Now Global

The power of Mojo is now in 29 countries. Explore global equities with the same cutting-edge features you love.

Dashboard
1

Poor long term growth as Net Sales has grown by an annual rate of 8.35% over the last 5 years

 
2

Flat results in Sep 25

3

With ROE of 13.1, it has a Very Expensive valuation with a 2.3 Price to Book Value

4

Despite the size of the company, domestic mutual funds hold only 1.56% of the company

5

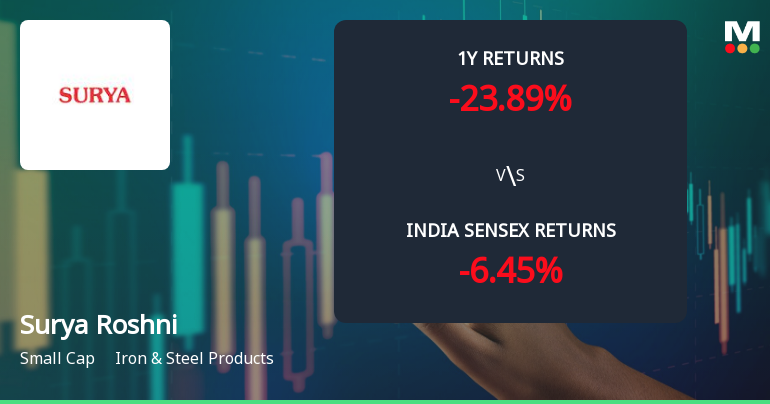
Underperformed the market in the last 1 year

stock-summaryMojo Parameters
Mojo Parameters
Loading Valuation Snapshot...
Stock DNA
stock-summary
Industry

Iron & Steel Products

stock-summary
Market cap

INR 5,665 Cr (Small Cap)

stock-summary
P/E

17.00

stock-summary
Industry P/E

28

stock-summary
Dividend Yield

2.10%

stock-summary
Debt Equity

-0.15

stock-summary
Return on Equity

13.07%

stock-summary
Price to Book

2.27

Revenue and Profits:
Net Sales:
1,845 Cr
(Quarterly Results - Sep 2025)
Net Profit:
74 Cr
stock-summaryTotal Returns
Total Returns (Price + Dividend) stock-summary
Dividend Yield (2.1%)
TimePeriod
Price Return
Dividend Return
Total Return
3 Months
-13.21%
0.84%
-12.37%
6 Months
-24.05%
1.61%
-22.44%
1 Year
-10.81%
1.87%
-8.94%
2 Years
1.56%
3.77%
5.33%
3 Years
99.46%
16.53%
115.99%
4 Years
66.67%
15.66%
82.33%
5 Years
282.6%
28.21%
310.81%

Latest dividend: 2.5 per share ex-dividend date: Nov-17-2025

Risk Adjusted Returns v/s stock-summary
Returns Beta
Icon
Beta has not been calculated since enough price history is not available
stock-summaryNews & Corporate Actions
News

Why is Surya Roshni falling/rising?

Recent Price Movement and Market Context

Surya Roshni’s shares have been under pressure for the past nine consecutive trading sessions, resulting in a cumulative loss of approximately 15.57% during this period. The stock’s intraday low of ₹255.15 on 21-Nov highlights the persistent selling momentum. This decline is in line with the broader Steel/Sponge Iron/Pig Iron sector, which has also experienced a downturn of 2.61% on the same day. However, Surya Roshni’s underperformance is more pronounced when compared to benchmark indices such as the Sensex, which has posted modest gains of 0.79% over the past week and 0.95% over the past month.

Trading volumes further underscore the bearish sentiment, with the weighted average price skewed towards the lower end of the day’s ra...

Read More
Announcements stock-summary

Announcement under Regulation 30 (LODR)-Newspaper Publication

02-Dec-2025 | Source : BSE

Nortice - ease of doing investment special window for lodgment of transfer request

Boards Comment

02-Dec-2025 | Source : BSE

Boards Comment

Updated/Changed Investor Grievances Email ID Of The Company

29-Nov-2025 | Source : BSE

updated investor grievances email ID : investorgrievances@surya.in

Corporate Actions stock-summary
stock-summary
BOARD MEETING

No Upcoming Board Meetings

stock-summary
DIVIDEND

Surya Roshni Ltd has declared 50% dividend, ex-date: 17 Nov 25

stock-summary
SPLITS

Surya Roshni Ltd has announced 5:10 stock split, ex-date: 06 Oct 23

stock-summary
BONUS

Surya Roshni Ltd has announced 1:1 bonus issue, ex-date: 01 Jan 25

stock-summary
RIGHTS

No Rights history available

stock-summaryKey Factors
Quality key factors stock-summary
Factor
Value
Sales Growth (5y)
8.35%
EBIT Growth (5y)
12.50%
EBIT to Interest (avg)
12.76
Debt to EBITDA (avg)
0.75
Net Debt to Equity (avg)
-0.15
Sales to Capital Employed (avg)
3.30
Tax Ratio
25.75%
Dividend Payout Ratio
16.48%
Pledged Shares
0
Institutional Holding
6.61%
ROCE (avg)
18.83%
ROE (avg)
14.67%
Valuation key factors
Factor
Value
P/E Ratio
17
Industry P/E
28
Price to Book Value
2.27
EV to EBIT
12.83
EV to EBITDA
9.85
EV to Capital Employed
2.49
EV to Sales
0.71
PEG Ratio
7.75
Dividend Yield
2.10%
ROCE (Latest)
19.42%
ROE (Latest)
13.07%
Technicals key factors
Indicator
Weekly
Monthly
MACD
Bearish
Mildly Bearish
RSI
No Signal
No Signal
Bollinger Bands
Bearish
Bearish
Moving Averages
Bearish (Daily)
KST
Bearish
Mildly Bearish
Dow Theory
No Trend
No Trend
OBV
No Trend
No Trend
stock-summary Technical Indicator Scale: Bearish, Mildly Bearish, Sideways, Mildly Bullish, Bullish  Turned 
stock-summaryShareholding
Shareholding Snapshot : Sep 2025stock-summary
Shareholding Compare (%holding) stock-summary
Majority shareholders

Promoters

Pledged Promoter Holdings

None

Mutual Funds

Held by 7 Schemes (0.59%)

FIIs

Held by 123 FIIs (4.95%)

Promoter with highest holding

Diwakar Marketing Private Limited (10.36%)

Highest Public shareholder

Henco Commercials Private Limited (2.36%)

Individual Investors Holdings

21.63%

stock-summaryFinancial
[
  {
    "link": "quarterly",
    "btn_text": "All Quarterly Results",
    "header": "Quarterly Results Snapshot (Consolidated) - Sep'25 - QoQ",
    "rhs": [
      {
        "prefix": "Net Sales ",
        "suffix": "QoQ Growth in quarter ended Sep 2025 is 15.00% vs -25.23% in Jun 2025",
        "dir": 1
      },
      {
        "prefix": "Consolidated Net Profit ",
        "suffix": "QoQ Growth in quarter ended Sep 2025 is 120.61% vs -74.15% in Jun 2025",
        "dir": 1
      }
    ],
    "table": {
      "header": [
        "Sep'25",
        "Jun'25",
        "Change(%)"
      ],
      "body": [
        {
          "field": "Net Sales",
          "val1": "1,845.16",
          "val2": "1,604.52",
          "chgp": "15.00%",
          "chgp_class": "positive"
        },
        {
          "field": "Operating Profit (PBDIT) excl Other Income",
          "val1": "118.26",
          "val2": "69.78",
          "chgp": "69.48%",
          "chgp_class": "positive"
        },
        {
          "field": "Interest",
          "val1": "9.10",
          "val2": "5.12",
          "chgp": "77.73%",
          "chgp_class": "negative"
        },
        {
          "field": "Exceptional Items",
          "val1": "0.00",
          "val2": "0.00",
          "chgp": "",
          "chgp_class": "neutral"
        },
        {
          "field": "Consolidate Net Profit",
          "val1": "74.19",
          "val2": "33.63",
          "chgp": "120.61%",
          "chgp_class": "positive"
        },
        {
          "field": "Operating Profit Margin (Excl OI)",
          "val1": "6.41%",
          "val2": "4.35%",
          "chgp": "2.06%",
          "chgp_class": "positive"
        }
      ]
    }
  },
  {
    "link": "half-yearly",
    "btn_text": "All Half Yearly Results",
    "header": "Half Yearly Results Snapshot (Consolidated) - Sep'25",
    "rhs": [
      {
        "prefix": "Net Sales ",
        "suffix": " Growth in half year ended Sep 2025 is 0.81% vs -9.73% in Sep 2024",
        "dir": 1
      },
      {
        "prefix": "Consolidated Net Profit ",
        "suffix": " Growth in half year ended Sep 2025 is -14.84% vs -6.31% in Sep 2024",
        "dir": -1
      }
    ],
    "table": {
      "header": [
        "Sep'25",
        "Sep'24",
        "Change(%)"
      ],
      "body": [
        {
          "field": "Net Sales",
          "val1": "3,449.68",
          "val2": "3,422.08",
          "chgp": "0.81%",
          "chgp_class": "positive"
        },
        {
          "field": "Operating Profit (PBDIT) excl Other Income",
          "val1": "188.04",
          "val2": "227.12",
          "chgp": "-17.21%",
          "chgp_class": "negative"
        },
        {
          "field": "Interest",
          "val1": "14.22",
          "val2": "11.33",
          "chgp": "25.51%",
          "chgp_class": "negative"
        },
        {
          "field": "Exceptional Items",
          "val1": "0.00",
          "val2": "0.00",
          "chgp": "",
          "chgp_class": "neutral"
        },
        {
          "field": "Consolidate Net Profit",
          "val1": "107.82",
          "val2": "126.61",
          "chgp": "-14.84%",
          "chgp_class": "negative"
        },
        {
          "field": "Operating Profit Margin (Excl OI)",
          "val1": "5.45%",
          "val2": "6.64%",
          "chgp": "-1.19%",
          "chgp_class": "negative"
        }
      ]
    }
  },
  {
    "link": "nine-monthly",
    "btn_text": "All Nine Monthly Results",
    "header": "Nine Monthly Results Snapshot (Consolidated) - Dec'24",
    "rhs": [
      {
        "prefix": "Net Sales ",
        "suffix": "YoY Growth in nine months ended Dec 2024 is -7.66% vs -1.99% in Dec 2023",
        "dir": -1
      },
      {
        "prefix": "Consolidated Net Profit ",
        "suffix": "YoY Growth in nine months ended Dec 2024 is -3.88% vs 25.18% in Dec 2023",
        "dir": -1
      }
    ],
    "table": {
      "header": [
        "Dec'24",
        "Dec'23",
        "Change(%)"
      ],
      "body": [
        {
          "field": "Net Sales",
          "val1": "5,290.04",
          "val2": "5,728.80",
          "chgp": "-7.66%",
          "chgp_class": "negative"
        },
        {
          "field": "Operating Profit (PBDIT) excl Other Income",
          "val1": "376.80",
          "val2": "406.55",
          "chgp": "-7.32%",
          "chgp_class": "negative"
        },
        {
          "field": "Interest",
          "val1": "15.90",
          "val2": "20.06",
          "chgp": "-20.74%",
          "chgp_class": "positive"
        },
        {
          "field": "Exceptional Items",
          "val1": "0.00",
          "val2": "0.00",
          "chgp": "",
          "chgp_class": "neutral"
        },
        {
          "field": "Consolidate Net Profit",
          "val1": "216.51",
          "val2": "225.24",
          "chgp": "-3.88%",
          "chgp_class": "negative"
        },
        {
          "field": "Operating Profit Margin (Excl OI)",
          "val1": "7.12%",
          "val2": "7.10%",
          "chgp": "0.02%",
          "chgp_class": "positive"
        }
      ]
    }
  },
  {
    "link": "annual",
    "btn_text": "All Annual Results",
    "header": "Annual Results Snapshot (Consolidated) - Mar'25",
    "rhs": [
      {
        "prefix": "Net Sales ",
        "suffix": "YoY Growth in year ended Mar 2025 is -4.78% vs -2.34% in Mar 2024",
        "dir": -1
      },
      {
        "prefix": "Consolidated Net Profit ",
        "suffix": "YoY Growth in year ended Mar 2025 is 5.30% vs -1.90% in Mar 2024",
        "dir": 1
      }
    ],
    "table": {
      "header": [
        "Mar'25",
        "Mar'24",
        "Change(%)"
      ],
      "body": [
        {
          "field": "Net Sales",
          "val1": "7,435.87",
          "val2": "7,809.27",
          "chgp": "-4.78%",
          "chgp_class": "negative"
        },
        {
          "field": "Operating Profit (PBDIT) excl Other Income",
          "val1": "579.21",
          "val2": "572.42",
          "chgp": "1.19%",
          "chgp_class": "positive"
        },
        {
          "field": "Interest",
          "val1": "20.74",
          "val2": "24.05",
          "chgp": "-13.76%",
          "chgp_class": "positive"
        },
        {
          "field": "Exceptional Items",
          "val1": "0.00",
          "val2": "0.00",
          "chgp": "",
          "chgp_class": "neutral"
        },
        {
          "field": "Consolidate Net Profit",
          "val1": "346.60",
          "val2": "329.16",
          "chgp": "5.30%",
          "chgp_class": "positive"
        },
        {
          "field": "Operating Profit Margin (Excl OI)",
          "val1": "7.79%",
          "val2": "7.33%",
          "chgp": "0.46%",
          "chgp_class": "positive"
        }
      ]
    }
  }
]
Quarterly Results Snapshot (Consolidated) - Sep'25 - QoQstock-summary
Sep'25
Jun'25
Change(%)
Net Sales
1,845.16
1,604.52
15.00%
Operating Profit (PBDIT) excl Other Income
118.26
69.78
69.48%
Interest
9.10
5.12
77.73%
Exceptional Items
0.00
0.00
Consolidate Net Profit
74.19
33.63
120.61%
Operating Profit Margin (Excl OI)
6.41%
4.35%
2.06%
Values in Rs Cr.
Direction Arrows
Net Sales

QoQ Growth in quarter ended Sep 2025 is 15.00% vs -25.23% in Jun 2025

Direction Arrows
Consolidated Net Profit

QoQ Growth in quarter ended Sep 2025 is 120.61% vs -74.15% in Jun 2025

Half Yearly Results Snapshot (Consolidated) - Sep'25stock-summary
Sep'25
Sep'24
Change(%)
Net Sales
3,449.68
3,422.08
0.81%
Operating Profit (PBDIT) excl Other Income
188.04
227.12
-17.21%
Interest
14.22
11.33
25.51%
Exceptional Items
0.00
0.00
Consolidate Net Profit
107.82
126.61
-14.84%
Operating Profit Margin (Excl OI)
5.45%
6.64%
-1.19%
Values in Rs Cr.
Direction Arrows
Net Sales

Growth in half year ended Sep 2025 is 0.81% vs -9.73% in Sep 2024

Direction Arrows
Consolidated Net Profit

Growth in half year ended Sep 2025 is -14.84% vs -6.31% in Sep 2024

Nine Monthly Results Snapshot (Consolidated) - Dec'24stock-summary
Dec'24
Dec'23
Change(%)
Net Sales
5,290.04
5,728.80
-7.66%
Operating Profit (PBDIT) excl Other Income
376.80
406.55
-7.32%
Interest
15.90
20.06
-20.74%
Exceptional Items
0.00
0.00
Consolidate Net Profit
216.51
225.24
-3.88%
Operating Profit Margin (Excl OI)
7.12%
7.10%
0.02%
Values in Rs Cr.
Direction Arrows
Net Sales

YoY Growth in nine months ended Dec 2024 is -7.66% vs -1.99% in Dec 2023

Direction Arrows
Consolidated Net Profit

YoY Growth in nine months ended Dec 2024 is -3.88% vs 25.18% in Dec 2023

Annual Results Snapshot (Consolidated) - Mar'25stock-summary
Mar'25
Mar'24
Change(%)
Net Sales
7,435.87
7,809.27
-4.78%
Operating Profit (PBDIT) excl Other Income
579.21
572.42
1.19%
Interest
20.74
24.05
-13.76%
Exceptional Items
0.00
0.00
Consolidate Net Profit
346.60
329.16
5.30%
Operating Profit Margin (Excl OI)
7.79%
7.33%
0.46%
Values in Rs Cr.
Direction Arrows
Net Sales

YoY Growth in year ended Mar 2025 is -4.78% vs -2.34% in Mar 2024

Direction Arrows
Consolidated Net Profit

YoY Growth in year ended Mar 2025 is 5.30% vs -1.90% in Mar 2024

stock-summaryCompany CV
About Surya Roshni Ltd stock-summary
stock-summary
Surya Roshni Ltd
Small Cap
Iron & Steel Products
Surya Roshni Limited (Formerly known Prakash Tubes Limited) was established in 1973 under the leadership of Mr. J.P. Agarwal. The Company acted as a Steel Pipe manufacturer and gradually diversified into Lighting in 1984, PVC pipes in 2010 and consumer durables like fans and home appliances in 2014-15. The Steel Pipes and Strips business, under the brand `Prakash Surya', manufactures a wide range of products, and is India's largest manufacturer of GI pipes and the largest Exporter of ERW Pipes.
Company Coordinates stock-summary
Company Details
Prakash Nagar Sankhol , Bahadurgarh Haryana : 124507
stock-summary
Tel: 01276-241540
stock-summary
surya@suryasteelpipe.com
Registrar Details
MAS Services Ltd, T-34 , 2nd Floor, Okhla Industrial Area, Phase - II, New Delhi