
Compare Goodluck India with Similar Stocks
Dashboard
Healthy long term growth as Operating profit has grown by an annual rate 30.07%
Positive results in Mar 26
With ROCE of 12.9, it has a Fair valuation with a 2.3 Enterprise value to Capital Employed
Increasing Participation by Institutional Investors
Consistent Returns over the last 3 years
Stock DNA
Iron & Steel Products
INR 4,734 Cr (Small Cap)
26.00
26
0.49%
0.72
12.12%
3.19
Total Returns (Price + Dividend) 
Latest dividend: 3.008161110885541 per share ex-dividend date: Feb-18-2026
Risk Adjusted Returns v/s
Returns Beta

News
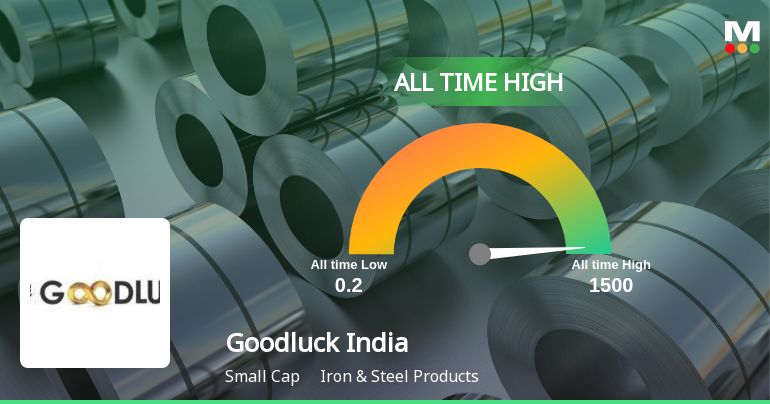
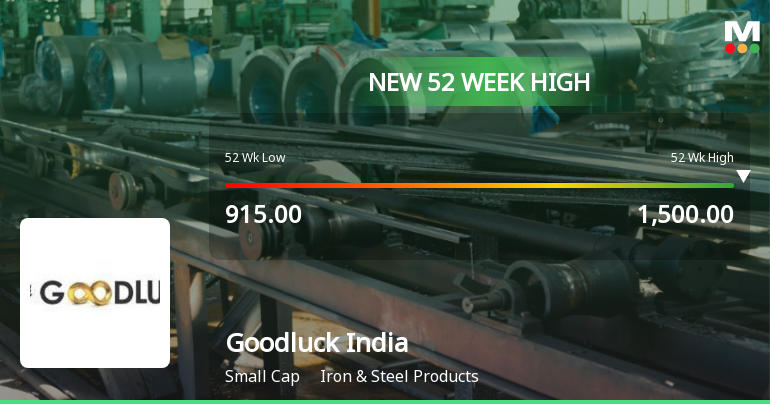
Broad-Based Technical Strength Lifts Goodluck India Ltd to 52-Week High of Rs 1485.85
With a decisive surge to Rs 1485.85 on 22 Jun 2026, Goodluck India Ltd has reached a new 52-week and all-time high, marking a 34.98% gain over the past year against a Sensex decline of 6.42%. This milestone caps a four-day winning streak that has propelled the stock 11.57% higher, underscoring robust momentum driven by a confluence of technical signals.
Read full news article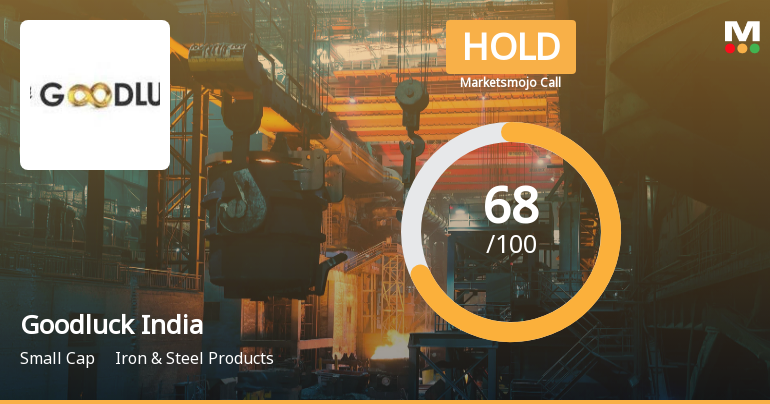
Goodluck India Ltd Downgraded to Hold Amid Fair Valuation and Mixed Financial Signals
Goodluck India Ltd, a prominent player in the Iron & Steel Products sector, has seen its investment rating downgraded from Buy to Hold as of 19 June 2026. The revision reflects a reassessment across key parameters including valuation, quality, financial trends, and technical indicators, signalling a more cautious stance despite the company’s robust operational performance and strong market returns.
Read full news article Announcements
Announcement under Regulation 30 (LODR)-Award_of_Order_Receipt_of_Order
19-Jun-2026 | Source : BSEReceiving of Order by Goodluck Defence and Aerospace Limited Subsidiary of the Company of Rs. 255 crores approx. for supply of 155 mm long range empty shells in ready to fill Condition
Announcement under Regulation 30 (LODR)-Earnings Call Transcript
03-Jun-2026 | Source : BSEEarning call Transcript
Compliances-Reg.24(A)-Annual Secretarial Compliance
29-May-2026 | Source : BSEAnnual Secretarial Compliance Report for financial year 2025-2026
Corporate Actions

No Upcoming Board Meetings

Goodluck India Ltd has declared 150% dividend, ex-date: 18 Feb 26

Goodluck India Ltd has announced 2:10 stock split, ex-date: 12 Jun 09

No Bonus history available

No Rights history available
Quality key factors
Valuation key factors
Technicals key factors
 Technical Indicator Scale: Bearish, Mildly Bearish, Sideways, Mildly Bullish, Bullish Turned
 Shareholding Snapshot : Mar 2026
Shareholding Compare (%holding)
Promoters
None
Held by 2 Schemes (0.97%)
Held by 47 FIIs (1.55%)
Nitin Garg (4.47%)
Gauravrajsingh Vijaysingh Rathore (1.5%)
31.3%
Quarterly Results Snapshot (Consolidated) - Mar'26 - QoQ

QoQ Growth in quarter ended Mar 2026 is 4.95% vs 4.62% in Dec 2025
QoQ Growth in quarter ended Mar 2026 is 25.00% vs 3.00% in Dec 2025
Half Yearly Results Snapshot (Consolidated) - Sep'25

Growth in half year ended Sep 2025 is 4.52% vs 8.33% in Sep 2024
Growth in half year ended Sep 2025 is 0.72% vs 29.47% in Sep 2024
Nine Monthly Results Snapshot (Consolidated) - Dec'25
YoY Growth in nine months ended Dec 2025 is 6.38% vs 7.97% in Dec 2024
YoY Growth in nine months ended Dec 2025 is 2.65% vs 29.30% in Dec 2024
Annual Results Snapshot (Consolidated) - Mar'26
YoY Growth in year ended Mar 2026 is 4.18% vs 11.66% in Mar 2025
YoY Growth in year ended Mar 2026 is 9.63% vs 24.94% in Mar 2025
About Goodluck India Ltd

Company Coordinates


