
Compare Kalyani Steels with Similar Stocks
Dashboard
Company has a Debt to Equity ratio (avg) of 0.01 times
Poor long term growth as Net Sales has grown by an annual rate of 9.21% and Operating profit at 6.77% over the last 5 years
Flat results in Mar 26
With ROE of 12.4, it has a Very Expensive valuation with a 1.9 Price to Book Value
Majority shareholders : Promoters
Market Beating performance in long term as well as near term
Stock DNA
Iron & Steel Products
INR 4,031 Cr (Small Cap)
15.00
26
1.09%
-0.14
12.43%
1.91
Total Returns (Price + Dividend) 
Latest dividend: 10.027711797307997 per share ex-dividend date: Aug-11-2025
Risk Adjusted Returns v/s
Returns Beta

News
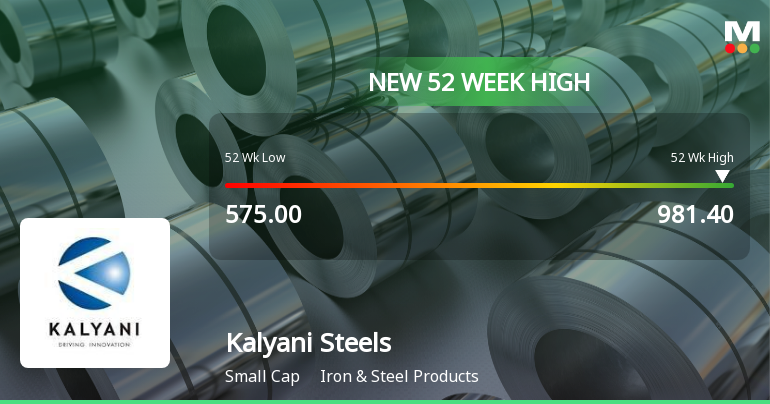
Broad-Based Technical Strength Lifts Kalyani Steels Ltd to 52-Week High of Rs 981.4
With a decisive surge to Rs 981.4 on 13 Jul 2026, Kalyani Steels Ltd has reached a fresh 52-week high, extending a four-day winning streak that has delivered a 12.64% return in that period alone. This milestone comes amid a backdrop of strong technical momentum, with the stock outperforming its sector by 2.73% today despite a broadly weaker market.
Read full news article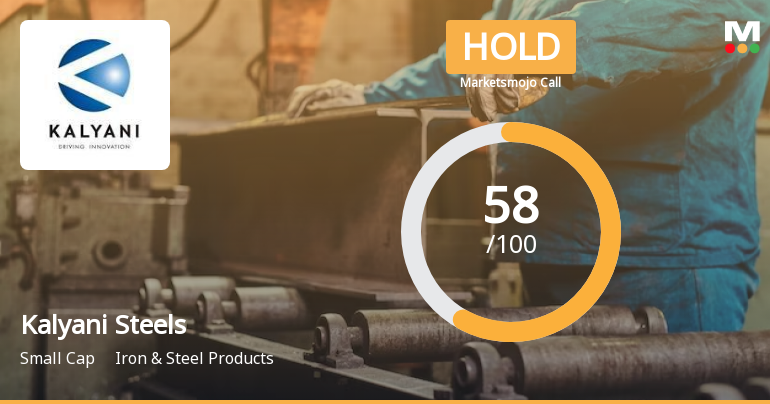
Kalyani Steels Ltd is Rated Hold by MarketsMOJO
Kalyani Steels Ltd is rated 'Hold' by MarketsMOJO, with this rating last updated on 08 June 2026. However, the analysis and financial metrics discussed below reflect the company’s current position as of 12 July 2026, providing investors with an up-to-date view of the stock’s fundamentals, valuation, financial trends, and technical outlook.
Read full news article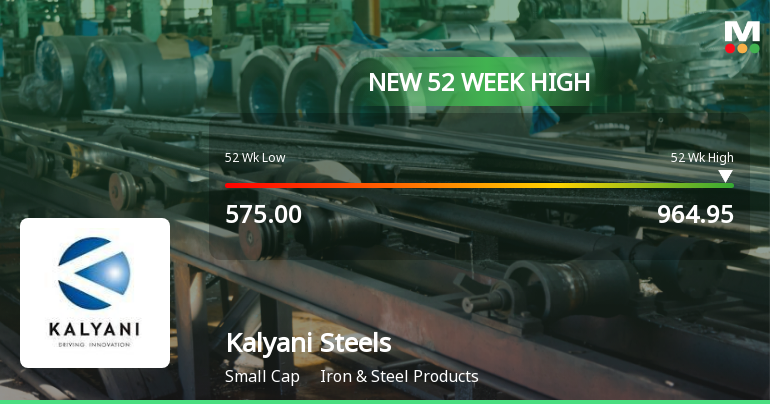
Broad-Based Technical Strength Lifts Kalyani Steels Ltd to 52-Week High of Rs 964.95
With a steady climb over the past three days culminating in an intraday high of Rs 963.8, Kalyani Steels Ltd is now just 0.83% shy of its 52-week peak of Rs 964.95. This momentum surge has been underpinned by a confluence of bullish technical indicators and a market environment that favours small-cap industrial stocks.
Read full news article Announcements
Kalyani Steels Limited - Other General Purpose
14-Nov-2019 | Source : NSEKalyani Steels Limited has informed the Exchange regarding Disclosure of Related Party Transactions for the half year ended September 30, 2019 in terms of Regulation 23(9) of the Securities and Exchange Board of India (Listing Obligations and Disclosure Requirements) Regulations, 2015
Shareholders meeting
28-Aug-2019 | Source : NSE
| Kalyani Steels Limited has submitted the Exchange a copy Srutinizers report of Annual General Meeting held on August 27, 2019. Further, the company has informed the Exchange regarding voting results. |
Shareholders meeting
27-Aug-2019 | Source : NSE
| Kalyani Steels Limited has informed the Exchange regarding Proceedings of Annual General Meeting held on August 27, 2019 |
Corporate Actions

No Upcoming Board Meetings

Kalyani Steels Ltd has declared 200% dividend, ex-date: 11 Aug 25

No Splits history available

No Bonus history available

No Rights history available
Quality key factors
Valuation key factors
Technicals key factors
 Technical Indicator Scale: Bearish, Mildly Bearish, Sideways, Mildly Bullish, Bullish Turned
 Shareholding Snapshot : Mar 2026
Shareholding Compare (%holding)
Promoters
None
Held by 6 Schemes (11.05%)
Held by 47 FIIs (1.82%)
Bf Investment Limited (39.06%)
Quant Mutual Fund A/c Quant Infrastructure Fund (5.99%)
17.13%
Quarterly Results Snapshot (Standalone) - Mar'26 - QoQ

QoQ Growth in quarter ended Mar 2026 is 4.76% vs 1.38% in Dec 2025
QoQ Growth in quarter ended Mar 2026 is 15.83% vs -0.81% in Dec 2025
Half Yearly Results Snapshot (Consolidated) - Sep'25
Not Applicable: The company has declared_date for only one period
Not Applicable: The company has declared_date for only one period
Nine Monthly Results Snapshot (Consolidated) - Dec'25

YoY Growth in nine months ended Dec 2025 is -5.31% vs 14.34% in Dec 2024
YoY Growth in nine months ended Dec 2025 is 5.76% vs 0.88% in Dec 2024
Annual Results Snapshot (Consolidated) - Mar'26
YoY Growth in year ended Mar 2026 is -6.88% vs 1.14% in Mar 2025
YoY Growth in year ended Mar 2026 is 0.63% vs 3.00% in Mar 2025
About Kalyani Steels Ltd

Company Coordinates


