
Compare Goodluck India with Similar Stocks
Stock DNA
Iron & Steel Products
INR 5,162 Cr (Small Cap)
28.00
26
0.45%
0.72
12.12%
3.48
Total Returns (Price + Dividend) 
Latest dividend: 3.008161110885541 per share ex-dividend date: Feb-18-2026
Risk Adjusted Returns v/s
Returns Beta

News
Goodluck India Ltd is Rated Hold by MarketsMOJO
Goodluck India Ltd is rated 'Hold' by MarketsMOJO, with this rating last updated on 19 June 2026. However, the analysis and financial metrics discussed here reflect the stock's current position as of 14 July 2026, providing investors with the latest insights into the company’s performance and outlook.
Read full news article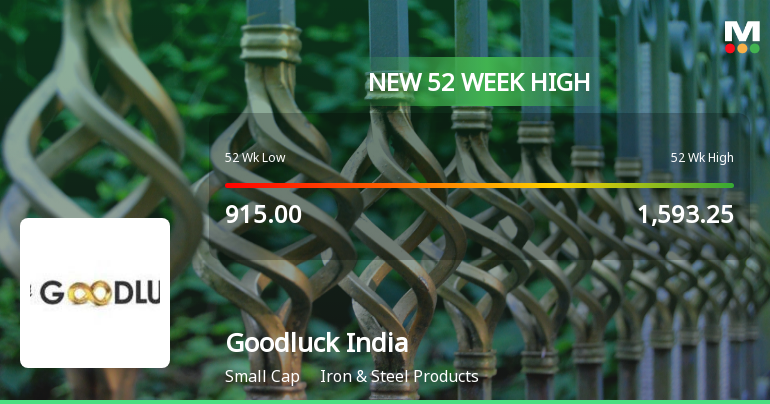
Broad-Based Technical Strength Lifts Goodluck India Ltd to 52-Week High of Rs 1596.35
Surging past its previous peaks, Goodluck India Ltd reached a fresh 52-week high of Rs 1596.35 on 13 Jul 2026, marking a remarkable 44.65% gain over the past year. This rally stands in stark contrast to the broader Sensex, which has declined by 6.55% over the same period, underscoring the stock’s strong momentum despite a subdued market backdrop.
Read full news article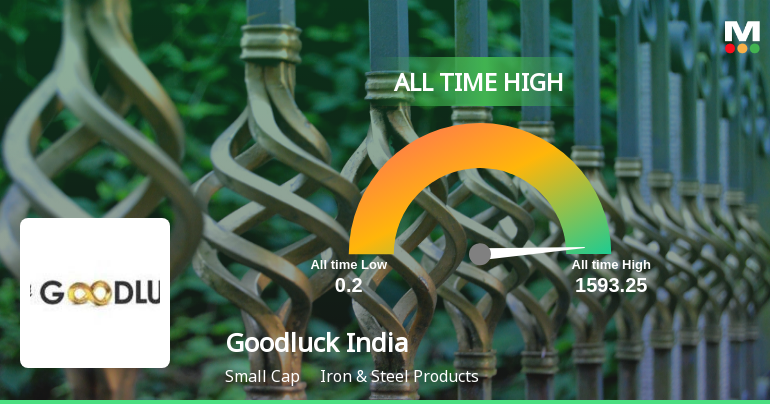
Announcements
Goodluck India Limited - Shareholders meeting
05-Nov-2019 | Source : NSEGoodluck India Limited has submitted the Exchange a copy Srutinizers report of Court Convened General Meeting held on November 02, 2019. Further, the company has informed the Exchange regarding voting results.
Goodluck India Limited - Shareholders meeting
04-Nov-2019 | Source : NSEGoodluck India Limited has informed the Exchange regarding Proceedings of Court Convened General Meeting held on November 02, 2019
Allotment of Securities
20-Sep-2019 | Source : NSE
| Goodluck India Limited has informed the Exchange regarding allotment of 1500000 securities pursuant to Convertible Securities at its meeting held on September 20, 2019 |
Corporate Actions

No Upcoming Board Meetings

Goodluck India Ltd has declared 150% dividend, ex-date: 18 Feb 26

Goodluck India Ltd has announced 2:10 stock split, ex-date: 12 Jun 09

No Bonus history available

No Rights history available
Quality key factors
Valuation key factors
Technicals key factors
 Technical Indicator Scale: Bearish, Mildly Bearish, Sideways, Mildly Bullish, Bullish Turned
 Shareholding Snapshot : Jun 2026
Shareholding Compare (%holding)
Promoters
None
Held by 3 Schemes (1.11%)
Held by 47 FIIs (2.48%)
Nitin Garg (4.47%)
Sageone-flagship Growth Oe Fund (2.43%)
29.81%
Quarterly Results Snapshot (Consolidated) - Mar'26 - QoQ

QoQ Growth in quarter ended Mar 2026 is 4.95% vs 4.62% in Dec 2025
QoQ Growth in quarter ended Mar 2026 is 25.00% vs 3.00% in Dec 2025
Half Yearly Results Snapshot (Consolidated) - Sep'25

Growth in half year ended Sep 2025 is 4.52% vs 8.33% in Sep 2024
Growth in half year ended Sep 2025 is 0.72% vs 29.47% in Sep 2024
Nine Monthly Results Snapshot (Consolidated) - Dec'25
YoY Growth in nine months ended Dec 2025 is 6.38% vs 7.97% in Dec 2024
YoY Growth in nine months ended Dec 2025 is 2.65% vs 29.30% in Dec 2024
Annual Results Snapshot (Consolidated) - Mar'26
YoY Growth in year ended Mar 2026 is 4.18% vs 11.66% in Mar 2025
YoY Growth in year ended Mar 2026 is 9.63% vs 24.94% in Mar 2025
About Goodluck India Ltd

Company Coordinates


