
Compare Indo Borax & Ch. with Similar Stocks
Dashboard
The company is Net-Debt Free
Poor long term growth as Operating profit has grown by an annual rate -0.92% of over the last 5 years
With ROE of 11.1, it has a Very Expensive valuation with a 3.2 Price to Book Value
100% of Promoter Shares are Pledged
Market Beating performance in long term as well as near term
Stock DNA
Commodity Chemicals
INR 1,233 Cr (Micro Cap)
29.00
45
0.26%
-0.54
11.08%
3.22
Total Returns (Price + Dividend) 
Latest dividend: 1 per share ex-dividend date: Sep-18-2025
Risk Adjusted Returns v/s
Returns Beta

News
Indo Borax & Chemicals Ltd is Rated Hold
Indo Borax & Chemicals Ltd is rated 'Hold' by MarketsMOJO, with this rating last updated on 13 May 2026. While the rating change occurred on that date, the analysis and financial metrics presented here reflect the company’s current position as of 28 June 2026, providing investors with an up-to-date view of the stock’s fundamentals, returns, and market performance.
Read full news article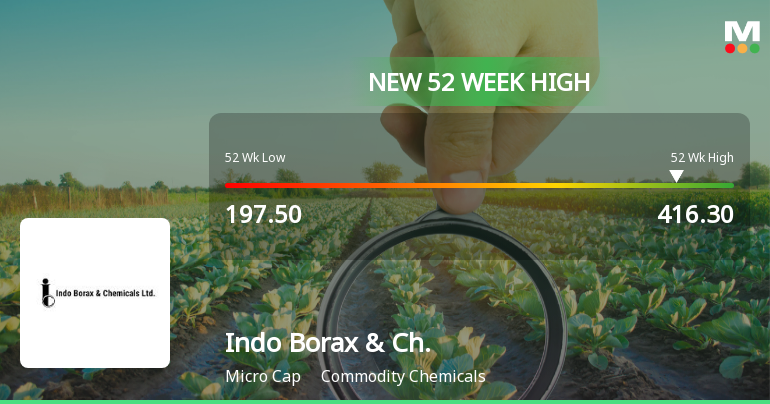
Broad-Based Technical Strength Lifts Indo Borax & Chemicals Ltd to 52-Week High of Rs 416.3
With a surge to Rs 416.3 on 23 Jun 2026, Indo Borax & Chemicals Ltd has reached a fresh 52-week high, nearly doubling from its low of Rs 197.5 over the past year. This milestone underscores a powerful momentum driven by a confluence of technical indicators aligning across multiple timeframes.
Read full news article
Announcements
Announcement under Regulation 30 (LODR)-Earnings Call Transcript
05-Jun-2026 | Source : BSETranscript of the Investor/Analyst Earnings Call held on Tuesday June 2 2026.
Announcement under Regulation 30 (LODR)-Analyst / Investor Meet - Outcome
02-Jun-2026 | Source : BSEIntimation of audio recording of Analysts/Institutional Investors/Organisations meet-Earnings Call.
Announcement under Regulation 30 (LODR)-Investor Presentation
28-May-2026 | Source : BSEInvestor Presentation for the quarter and year ended March 31 2026.
Corporate Actions

No Upcoming Board Meetings

Indo Borax & Chemicals Ltd has declared 100% dividend, ex-date: 18 Sep 25

Indo Borax & Chemicals Ltd has announced 1:10 stock split, ex-date: 27 Sep 21

No Bonus history available

No Rights history available
Quality key factors
Valuation key factors
Technicals key factors
 Technical Indicator Scale: Bearish, Mildly Bearish, Sideways, Mildly Bullish, Bullish Turned
 Shareholding Snapshot : Mar 2026
Shareholding Compare (%holding)
Non Institution
100
Held by 1 Schemes (0.37%)
Held by 5 FIIs (0.45%)
Sajal Sushilkumar Jain (26.35%)
Dipak Kanayalal Shah (1.14%)
30.78%
Quarterly Results Snapshot (Consolidated) - Mar'26 - QoQ

QoQ Growth in quarter ended Mar 2026 is 53.61% vs -29.09% in Dec 2025
QoQ Growth in quarter ended Mar 2026 is 56.74% vs -42.99% in Dec 2025
Half Yearly Results Snapshot (Consolidated) - Sep'25
Growth in half year ended Sep 2025 is 27.13% vs -13.89% in Sep 2024

Growth in half year ended Sep 2025 is 14.14% vs 20.09% in Sep 2024
Nine Monthly Results Snapshot (Consolidated) - Dec'25
YoY Growth in nine months ended Dec 2025 is 21.81% vs -14.19% in Dec 2024
YoY Growth in nine months ended Dec 2025 is 10.79% vs 17.14% in Dec 2024
Annual Results Snapshot (Consolidated) - Mar'26
YoY Growth in year ended Mar 2026 is 22.93% vs -8.38% in Mar 2025
YoY Growth in year ended Mar 2026 is 18.25% vs 9.06% in Mar 2025
About Indo Borax & Chemicals Ltd

Company Coordinates


