
Compare Indo Borax & Ch. with Similar Stocks
Dashboard
The company is Net-Debt Free
Poor long term growth as Operating profit has grown by an annual rate -0.92% of over the last 5 years
With ROE of 11.1, it has a Very Expensive valuation with a 3.2 Price to Book Value
100% of Promoter Shares are Pledged
Market Beating performance in long term as well as near term
Stock DNA
Commodity Chemicals
INR 1,244 Cr (Micro Cap)
29.00
43
0.26%
-0.54
11.08%
3.16
Total Returns (Price + Dividend) 
Latest dividend: 1 per share ex-dividend date: Sep-18-2025
Risk Adjusted Returns v/s
Returns Beta

News
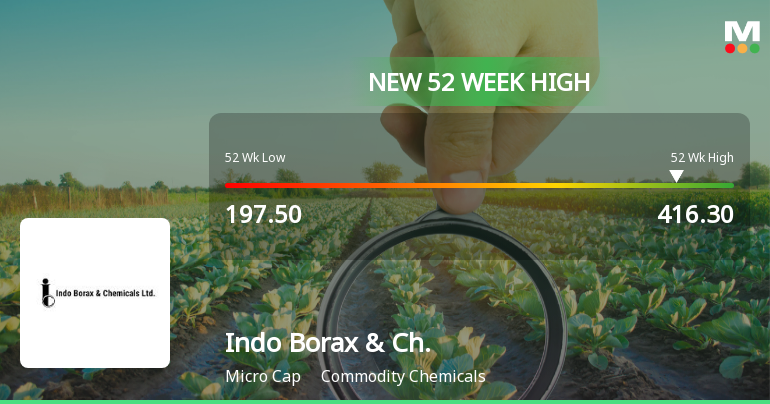
Broad-Based Technical Strength Lifts Indo Borax & Chemicals Ltd to 52-Week High of Rs 416.3
With a surge to Rs 416.3 on 23 Jun 2026, Indo Borax & Chemicals Ltd has reached a fresh 52-week high, nearly doubling from its low of Rs 197.5 over the past year. This milestone underscores a powerful momentum driven by a confluence of technical indicators aligning across multiple timeframes.
Read full news article
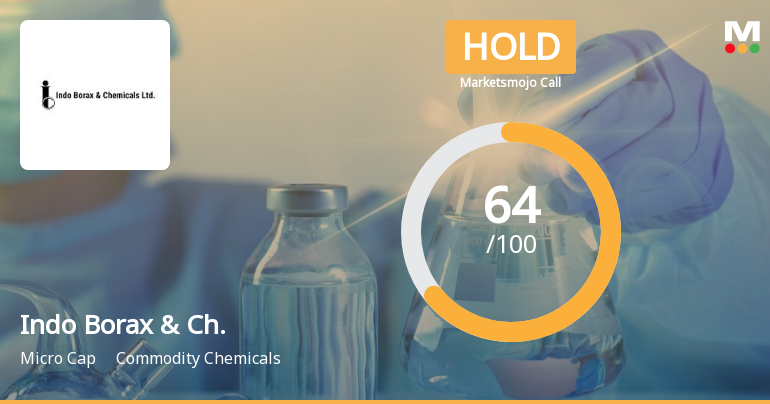
Indo Borax & Chemicals Ltd is Rated Hold
Indo Borax & Chemicals Ltd is rated 'Hold' by MarketsMOJO, a rating that was last updated on 13 May 2026. While this rating change occurred in mid-May, the analysis and financial metrics presented here reflect the stock’s current position as of 17 June 2026, providing investors with the most up-to-date perspective on the company’s performance and outlook.
Read full news article Announcements
Announcement under Regulation 30 (LODR)-Earnings Call Transcript
05-Jun-2026 | Source : BSETranscript of the Investor/Analyst Earnings Call held on Tuesday June 2 2026.
Announcement under Regulation 30 (LODR)-Analyst / Investor Meet - Outcome
02-Jun-2026 | Source : BSEIntimation of audio recording of Analysts/Institutional Investors/Organisations meet-Earnings Call.
Announcement under Regulation 30 (LODR)-Investor Presentation
28-May-2026 | Source : BSEInvestor Presentation for the quarter and year ended March 31 2026.
Corporate Actions

No Upcoming Board Meetings

Indo Borax & Chemicals Ltd has declared 100% dividend, ex-date: 18 Sep 25

Indo Borax & Chemicals Ltd has announced 1:10 stock split, ex-date: 27 Sep 21

No Bonus history available

No Rights history available
Quality key factors
Valuation key factors
Technicals key factors
 Technical Indicator Scale: Bearish, Mildly Bearish, Sideways, Mildly Bullish, Bullish Turned
 Shareholding Snapshot : Mar 2026
Shareholding Compare (%holding)
Non Institution
100
Held by 1 Schemes (0.37%)
Held by 5 FIIs (0.45%)
Sajal Sushilkumar Jain (26.35%)
Dipak Kanayalal Shah (1.14%)
30.78%
Quarterly Results Snapshot (Consolidated) - Mar'26 - QoQ

QoQ Growth in quarter ended Mar 2026 is 53.61% vs -29.09% in Dec 2025
QoQ Growth in quarter ended Mar 2026 is 56.74% vs -42.99% in Dec 2025
Half Yearly Results Snapshot (Consolidated) - Sep'25
Growth in half year ended Sep 2025 is 27.13% vs -13.89% in Sep 2024

Growth in half year ended Sep 2025 is 14.14% vs 20.09% in Sep 2024
Nine Monthly Results Snapshot (Consolidated) - Dec'25
YoY Growth in nine months ended Dec 2025 is 21.81% vs -14.19% in Dec 2024
YoY Growth in nine months ended Dec 2025 is 10.79% vs 17.14% in Dec 2024
Annual Results Snapshot (Consolidated) - Mar'26
YoY Growth in year ended Mar 2026 is 22.93% vs -8.38% in Mar 2025
YoY Growth in year ended Mar 2026 is 18.25% vs 9.06% in Mar 2025
About Indo Borax & Chemicals Ltd

Company Coordinates


