
Compare Beekay Steel Ind with Similar Stocks
Dashboard
Poor long term growth as Operating profit has grown by an annual rate -14.24% of over the last 5 years
The company has declared negative results for the last 8 consecutive quarters
Despite the size of the company, domestic mutual funds hold only 0% of the company
Underperformed the market in the last 1 year
Stock DNA
Iron & Steel Products
INR 799 Cr (Micro Cap)
21.00
25
0.25%
0.25
3.53%
0.74
Total Returns (Price + Dividend) 
Latest dividend: 1 per share ex-dividend date: Sep-15-2025
Risk Adjusted Returns v/s
Returns Beta

News

Beekay Steel Industries Ltd Technical Momentum Shifts Amid Mixed Market Signals
Beekay Steel Industries Ltd has experienced a subtle shift in its technical momentum, moving from a bearish stance to a mildly bearish outlook, reflecting a complex interplay of technical indicators. Despite a modest 2.00% gain on 2 July 2026, the stock remains under pressure with a MarketsMOJO Mojo Score of 29.0 and a Strong Sell grade, underscoring ongoing challenges in the iron and steel products sector.
Read full news article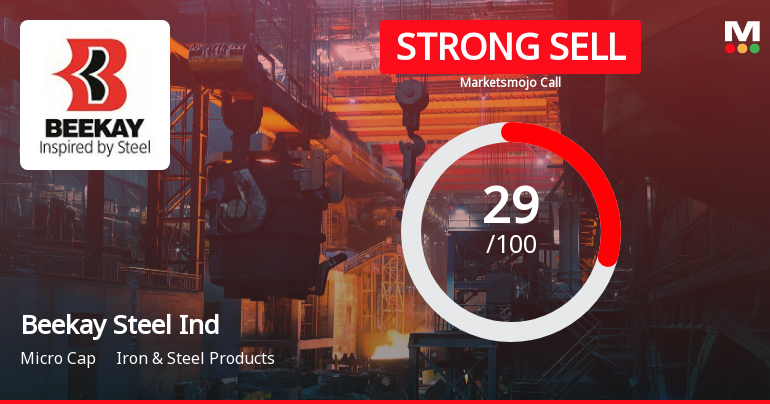
Beekay Steel Industries Downgraded to Strong Sell Amid Deteriorating Fundamentals and Bearish Technicals
Beekay Steel Industries Ltd has been downgraded from a Sell to a Strong Sell rating as of 29 June 2026, reflecting deteriorating fundamentals and increasingly bearish technical indicators. The micro-cap iron and steel products company faces significant challenges across quality, valuation, financial trends, and technical parameters, prompting a reassessment of its investment appeal.
Read full news article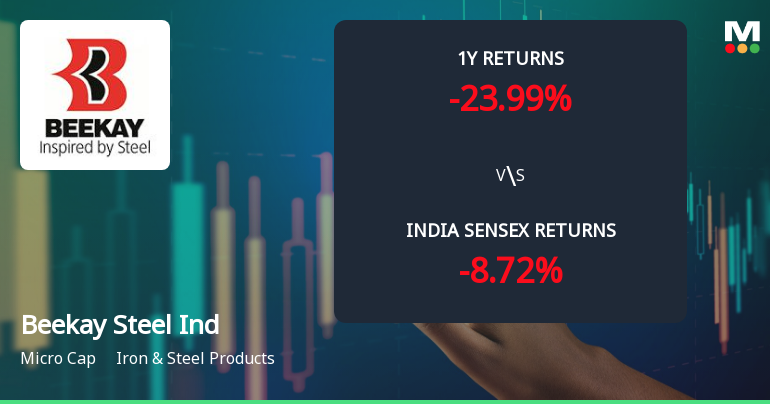
Beekay Steel Industries Ltd Faces Bearish Momentum Amid Technical Downgrade
Beekay Steel Industries Ltd, a micro-cap player in the Iron & Steel Products sector, has experienced a notable shift in its technical momentum, signalling increased bearishness. The stock’s recent downgrade to a Strong Sell rating by MarketsMOJO reflects deteriorating technical indicators and a challenging market environment, with price momentum weakening against broader benchmarks such as the Sensex.
Read full news article Announcements
Closure of Trading Window
25-Jun-2026 | Source : BSEClosure of Trading Window
Intimation Of Second 100 Days Campaign- Saksham Niveshak
20-Jun-2026 | Source : BSENewspaper Publication for Shareholders intimation for second 100 days campaign - Saksham Niveshak
Disclosures under Reg. 29(2) of SEBI (SAST) Regulations 2011
10-Jun-2026 | Source : BSEThe Exchange has received the disclosure under Regulation 29(2) of SEBI (Substantial Acquisition of Shares & Takeovers) Regulations 2011 for Century Vision Pvt Ltd
Corporate Actions

No Upcoming Board Meetings

Beekay Steel Industries Ltd has declared 10% dividend, ex-date: 15 Sep 25

No Splits history available

No Bonus history available

No Rights history available
Quality key factors
Valuation key factors
Technicals key factors
 Technical Indicator Scale: Bearish, Mildly Bearish, Sideways, Mildly Bullish, Bullish Turned
 Shareholding Snapshot : Mar 2026
Shareholding Compare (%holding)
Promoters
None
Held by 0 Schemes
Held by 1 FIIs (0.0%)
Century Vision Pvt. Ltd. (19.21%)
Jyotirmay Trading Private Limited (12.89%)
8.3%
Quarterly Results Snapshot (Consolidated) - Mar'26 - QoQ

QoQ Growth in quarter ended Mar 2026 is 17.61% vs 8.38% in Dec 2025

QoQ Growth in quarter ended Mar 2026 is -245.23% vs 19.00% in Dec 2025
Half Yearly Results Snapshot (Consolidated) - Sep'25
Growth in half year ended Sep 2025 is 15.51% vs -8.15% in Sep 2024
Growth in half year ended Sep 2025 is -32.58% vs -5.31% in Sep 2024
Nine Monthly Results Snapshot (Consolidated) - Dec'25
YoY Growth in nine months ended Dec 2025 is 12.14% vs -0.17% in Dec 2024
YoY Growth in nine months ended Dec 2025 is -32.57% vs -10.25% in Dec 2024
Annual Results Snapshot (Consolidated) - Mar'26
YoY Growth in year ended Mar 2026 is 9.17% vs 7.58% in Mar 2025
YoY Growth in year ended Mar 2026 is -58.86% vs -31.87% in Mar 2025
About Beekay Steel Industries Ltd

Company Coordinates


