
Compare Brahmaputra Inf. with Similar Stocks
Dashboard
Healthy long term growth as Operating profit has grown by an annual rate 31.41%
The company has declared Positive results for the last 5 consecutive quarters
With ROCE of 19, it has a Very Attractive valuation with a 1.3 Enterprise value to Capital Employed
100% of Promoter Shares are Pledged
Market Beating performance in long term as well as near term
Total Returns (Price + Dividend) 
Brahmaputra Inf. for the last several years.
Risk Adjusted Returns v/s
Returns Beta

News
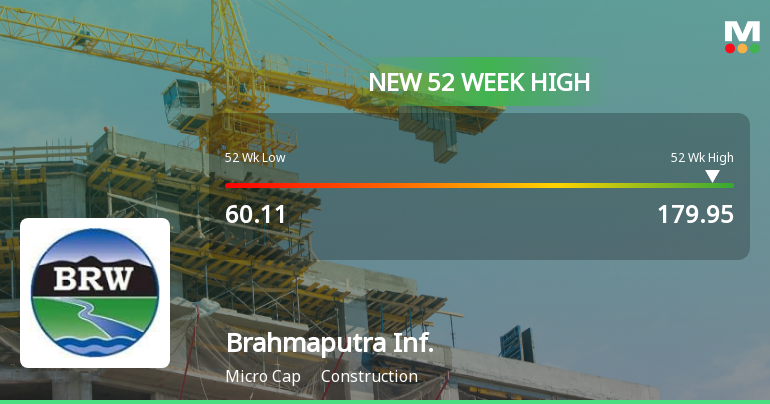
Brahmaputra Infrastructure Ltd Hits New 52-Week High of Rs 179.95 on Back of Strong Technical Signals
From a 52-week low of Rs 60.11 to a fresh peak of Rs 179.95, Brahmaputra Infrastructure Ltd has surged an impressive 170.89% over the past year, vastly outperforming the Sensex which declined 6.83% in the same period. This remarkable rally culminated in the stock hitting a new all-time high on 10 Jul 2026, fuelled by a confluence of bullish technical indicators and sustained price momentum.
Read full news article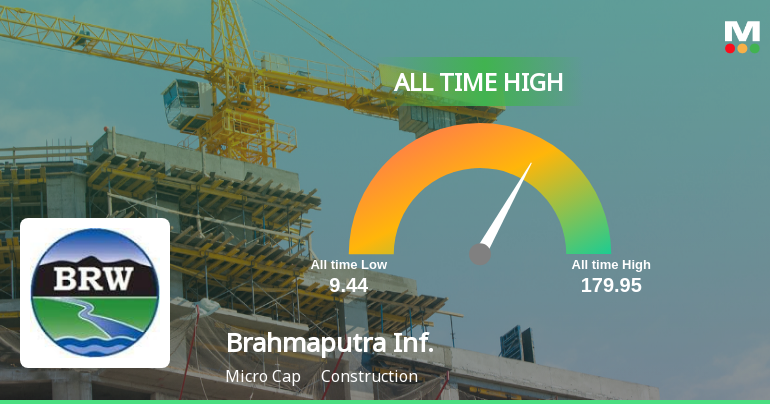
Brahmaputra Infrastructure Ltd Hits All-Time High of Rs 179.95 as Momentum Builds Across Timeframes
Extending its winning streak to two sessions, Brahmaputra Infrastructure Ltd surged to a fresh all-time high of Rs 179.95 on 10 Jul 2026, outperforming both its sector and the broader market indices.
Read full news article
Brahmaputra Infrastructure Ltd is Rated Hold by MarketsMOJO
Brahmaputra Infrastructure Ltd is rated 'Hold' by MarketsMOJO, with this rating last updated on 01 June 2026. However, the analysis and financial metrics discussed below reflect the company’s current position as of 05 July 2026, providing investors with the most up-to-date view of the stock’s fundamentals, returns, and market performance.
Read full news article Announcements
Closure of Trading Window
30-Jun-2026 | Source : BSEClosure of trading window for June Quarter Results 2026.
Announcement under Regulation 30 (LODR)-Award_of_Order_Receipt_of_Order
22-Jun-2026 | Source : BSEM/s Brahmaputra Emerged as L-1 Bidder of an total amount Rs. 70.18 Crores by Ministry of Road and Transport PWD Highway Aizawl -796001 Mizoram
Announcement under Regulation 30 (LODR)-Analyst / Investor Meet - Intimation
19-Jun-2026 | Source : BSEM/s Brahmaputra Infrastructure Limited management will attend the GIA Flagship Conference 2026 on dated 24th June 2026 in Mumbai.
Corporate Actions

No Upcoming Board Meetings

No Dividend history available

No Splits history available

No Bonus history available

No Rights history available
Quality key factors
Valuation key factors
Technicals key factors
 Technical Indicator Scale: Bearish, Mildly Bearish, Sideways, Mildly Bullish, Bullish Turned
 Shareholding Snapshot : Mar 2026
Shareholding Compare (%holding)
Promoters
100
Held by 1 Schemes (0.42%)
Held by 0 FIIs
M. L. Singhi And Associates Private Limited (18.82%)
Udi Sales Private Limited (1.57%)
18.22%
Quarterly Results Snapshot (Consolidated) - Mar'26 - YoY

YoY Growth in quarter ended Mar 2026 is -8.90% vs 90.89% in Mar 2025
YoY Growth in quarter ended Mar 2026 is -33.42% vs 394.43% in Mar 2025
Half Yearly Results Snapshot (Consolidated) - Sep'25

Growth in half year ended Sep 2025 is 63.90% vs -2.29% in Sep 2024
Growth in half year ended Sep 2025 is 313.81% vs -3.11% in Sep 2024
Nine Monthly Results Snapshot (Consolidated) - Dec'25
YoY Growth in nine months ended Dec 2025 is 91.24% vs -13.81% in Dec 2024
YoY Growth in nine months ended Dec 2025 is 498.13% vs -40.88% in Dec 2024
Annual Results Snapshot (Consolidated) - Mar'26
YoY Growth in year ended Mar 2026 is 49.47% vs 11.77% in Mar 2025
YoY Growth in year ended Mar 2026 is 100.74% vs 73.06% in Mar 2025
About Brahmaputra Infrastructure Ltd

Company Coordinates


