
Compare ACC with Similar Stocks
Stock DNA
Cement & Cement Products
INR 25,528 Cr (Small Cap)
12.00
34
0.55%
-0.01
10.27%
1.24
Total Returns (Price + Dividend) 
Latest dividend: 7.5 per share ex-dividend date: Jun-12-2026
Risk Adjusted Returns v/s
Returns Beta

News

ACC Ltd is Rated Sell by MarketsMOJO
ACC Ltd is rated Sell by MarketsMOJO, with this rating last updated on 28 January 2026. However, the analysis and financial metrics discussed here reflect the stock’s current position as of 13 June 2026, providing investors with the latest insights into the company’s performance and outlook.
Read full news article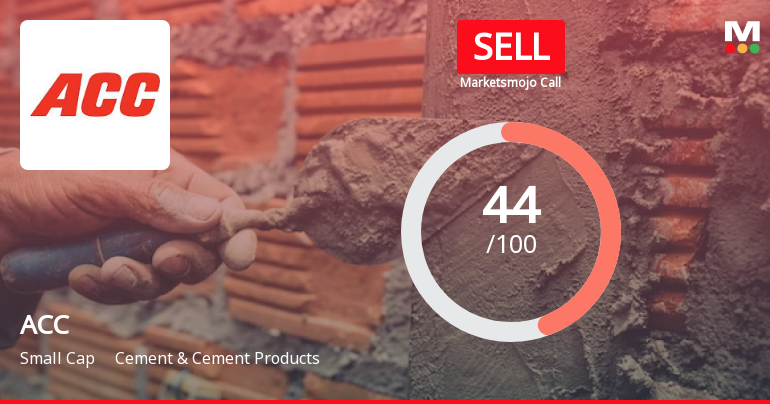
ACC Ltd is Rated Sell by MarketsMOJO
ACC Ltd is rated Sell by MarketsMOJO, with this rating last updated on 28 January 2026. However, the analysis and financial metrics discussed here reflect the stock's current position as of 02 June 2026, providing investors with an up-to-date view of the company’s performance and outlook.
Read full news article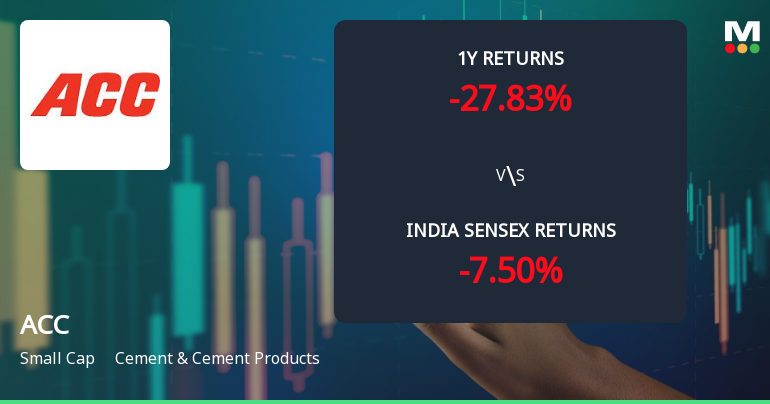
ACC Ltd Technical Momentum Shifts Amid Bearish Market Sentiment
ACC Ltd has experienced a subtle shift in its technical momentum, moving from a bearish to a mildly bearish trend, reflecting mixed signals from key indicators such as MACD, RSI, and moving averages. Despite a modest 2.16% gain on 27 May 2026, the stock remains under pressure with a MarketsMOJO Mojo Score of 44.0 and a recent downgrade from Hold to Sell, underscoring ongoing challenges in the cement sector.
Read full news article Announcements
Announcement under Regulation 30 (LODR)-Analyst / Investor Meet - Intimation
11-Jun-2026 | Source : BSEThe Company has informed the exchange about interaction with Investors / Analysts on June 16 2026 and June 17 2026.
Announcement under Regulation 30 (LODR)-Scheme of Arrangement
04-Jun-2026 | Source : BSEReceipt of Observation Letters with no adverse observations from BSE Limited and no objection from The National Stock Exchange of India Limited in relation to the scheme of Amalgamation of ACC Limited (Amalgamating Company) with Ambuja Cements Limited (Amalgamated Company).
Announcement under Regulation 30 (LODR)-Newspaper Publication
01-Jun-2026 | Source : BSENewspaper Advertisement - 90th Annual General Meeting Intimation of Record Date and E-Voting Information.
Corporate Actions

No Upcoming Board Meetings

ACC Ltd has declared 75% dividend, ex-date: 12 Jun 26

No Splits history available

No Bonus history available

No Rights history available
Quality key factors
Valuation key factors
Technicals key factors
 Technical Indicator Scale: Bearish, Mildly Bearish, Sideways, Mildly Bullish, Bullish Turned
 Shareholding Snapshot : Mar 2026
Shareholding Compare (%holding)
Promoters
None
Held by 31 Schemes (8.01%)
Held by 185 FIIs (5.93%)
Holderind Investments Ltd (4.48%)
Lici Ulip-growth Fund (10.51%)
11.92%
Quarterly Results Snapshot (Consolidated) - Mar'26 - QoQ

QoQ Growth in quarter ended Mar 2026 is 10.23% vs 7.97% in Dec 2025
QoQ Growth in quarter ended Mar 2026 is -41.06% vs -63.88% in Dec 2025
Half Yearly Results Snapshot (Consolidated) - Sep'25
Growth in half year ended Sep 2025 is 22.22% vs 2.05% in Sep 2024
Growth in half year ended Sep 2025 is 167.20% vs -34.50% in Sep 2024
Nine Monthly Results Snapshot (Consolidated) - Dec'25
YoY Growth in nine months ended Dec 2025 is 17.06% vs 8.63% in Dec 2024

YoY Growth in nine months ended Dec 2025 is 15.00% vs 18.65% in Dec 2024
Annual Results Snapshot (Consolidated) - Mar'26
YoY Growth in year ended Mar 2026 is 18.44% vs 9.83% in Mar 2025
YoY Growth in year ended Mar 2026 is -11.03% vs 2.88% in Mar 2025
About ACC Ltd

Company Coordinates


