
Compare Tamboli Industri with Similar Stocks
Dashboard
Weak Long Term Fundamental Strength with an average Return on Equity (ROE) of 9.21%
- Poor long term growth as Net Sales has grown by an annual rate of 3.75% and Operating profit at 2.32%
Positive results in Mar 26
With ROE of 8.4, it has a Attractive valuation with a 1.7 Price to Book Value
Majority shareholders : Promoters
Market Beating performance in long term as well as near term
Total Returns (Price + Dividend) 
Latest dividend: 1 per share ex-dividend date: Aug-25-2025
Risk Adjusted Returns v/s
Returns Beta

News
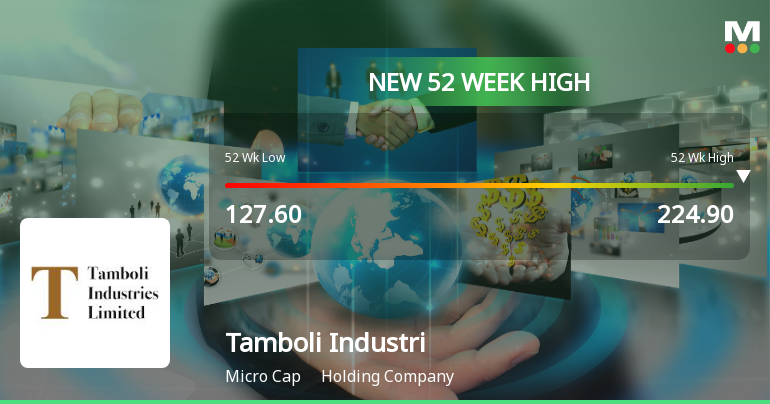
Broad-Based Technical Strength Lifts Tamboli Industries Ltd to 52-Week High of Rs 224.9
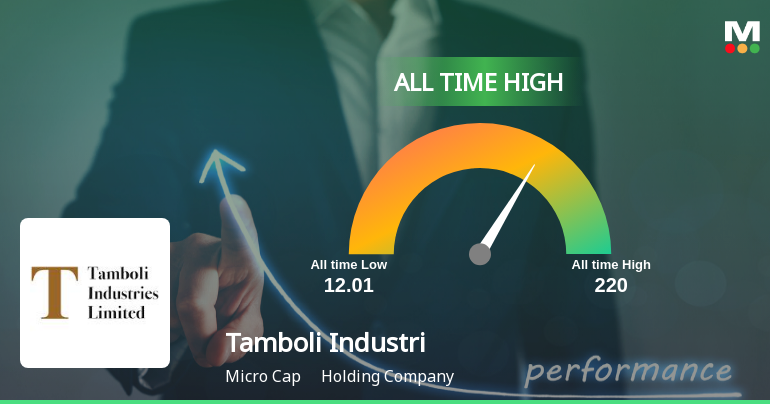
Surging to an all-time high of Rs 224.9 on 25 Jun 2026, Tamboli Industries Ltd has demonstrated remarkable price momentum, outperforming its sector by 3.73% today and extending a six-day winning streak that has delivered a 21.08% return in that period alone.
Read full news article
Announcements
Audited Financial Results (Standalone And Consolidated) For January-March 2026 Quarter (Q4) And Financial Year Ended 31.03.2026.
07-May-2026 | Source : BSEAudited Financial Results (Standalone and Consolidated) for January-March 2026 quarter (Q4) and Financial Year ended 31.03.2026.
Announcement under Regulation 30 (LODR)-Press Release / Media Release
07-May-2026 | Source : BSEPress and Media Release
Board Meeting Outcome for Approved Audited Financial Results For January-March 2026(Q4) And Financial Year Ended 31.03.2026 Recommendation Of Dividend For F.Y. 2025-2026 And Re-Appointment Of Mr. Vipul H. Pathak As Whole Time Director And CFO For A Period
07-May-2026 | Source : BSEApproved Audited Financial Results for January-March 2026(Q4) and Financial Year ended 31.03.2026 Recommendation of Dividend for F.Y. 2025-2026 and Re-appointment of Mr. Vipul H. Pathak as Whole Time Director and CFO for a period of 3 years.
Corporate Actions

No Upcoming Board Meetings

Tamboli Industries Ltd has declared 10% dividend, ex-date: 25 Aug 25

No Splits history available

No Bonus history available

No Rights history available
Quality key factors
Valuation key factors
Technicals key factors
 Technical Indicator Scale: Bearish, Mildly Bearish, Sideways, Mildly Bullish, Bullish Turned
 Shareholding Snapshot : Mar 2026
Shareholding Compare (%holding)
Promoters
None
Held by 0 Schemes
Held by 0 FIIs
Tamboli Vaibhav Bipin (40.36%)
Manoj Dua (4.64%)
36.86%
Quarterly Results Snapshot (Consolidated) - Mar'26 - YoY

YoY Growth in quarter ended Mar 2026 is 14.90% vs 16.95% in Mar 2025
YoY Growth in quarter ended Mar 2026 is 63.35% vs 76.76% in Mar 2025
Half Yearly Results Snapshot (Consolidated) - Sep'25

Growth in half year ended Sep 2025 is 16.22% vs -19.62% in Sep 2024
Growth in half year ended Sep 2025 is 8.45% vs -23.32% in Sep 2024
Nine Monthly Results Snapshot (Consolidated) - Dec'25
YoY Growth in nine months ended Dec 2025 is 17.47% vs -15.48% in Dec 2024
YoY Growth in nine months ended Dec 2025 is 9.81% vs -14.89% in Dec 2024
Annual Results Snapshot (Consolidated) - Mar'26
YoY Growth in year ended Mar 2026 is 16.72% vs -8.19% in Mar 2025
YoY Growth in year ended Mar 2026 is 27.24% vs 2.39% in Mar 2025
About Tamboli Industries Ltd

Company Coordinates


