
Compare Tamboli Industri with Similar Stocks
Dashboard
Weak Long Term Fundamental Strength with an average Return on Equity (ROE) of 9.21%
- Poor long term growth as Net Sales has grown by an annual rate of 3.75% and Operating profit at 2.32%
Positive results in Mar 26
With ROE of 8.4, it has a Attractive valuation with a 1.8 Price to Book Value
Majority shareholders : Promoters
Market Beating performance in long term as well as near term
Total Returns (Price + Dividend) 
Latest dividend: 1 per share ex-dividend date: Aug-25-2025
Risk Adjusted Returns v/s
Returns Beta

News
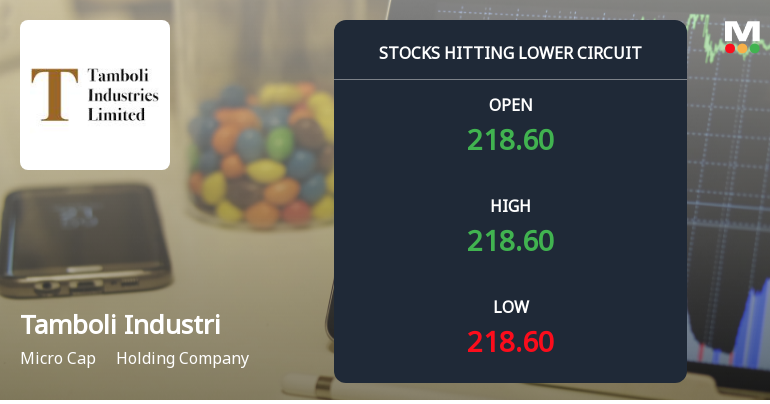
Tamboli Industries Ltd Locks at Lower Circuit With 5% Loss — Sellers Queue, No Buyers in Sight
At Rs 217.00, sellers were still queuing — but there were no buyers willing to take the other side. Tamboli Industries Ltd locked at its lower circuit of 5% on 10 Jul 2026, with unfilled sell orders and a frozen price.
Read full news article
Tamboli Industries Ltd is Rated Hold
Tamboli Industries Ltd is rated 'Hold' by MarketsMOJO, with this rating last updated on 21 May 2026. However, the analysis and financial metrics presented here reflect the stock's current position as of 08 July 2026, providing investors with an up-to-date view of its performance and prospects.
Read full news article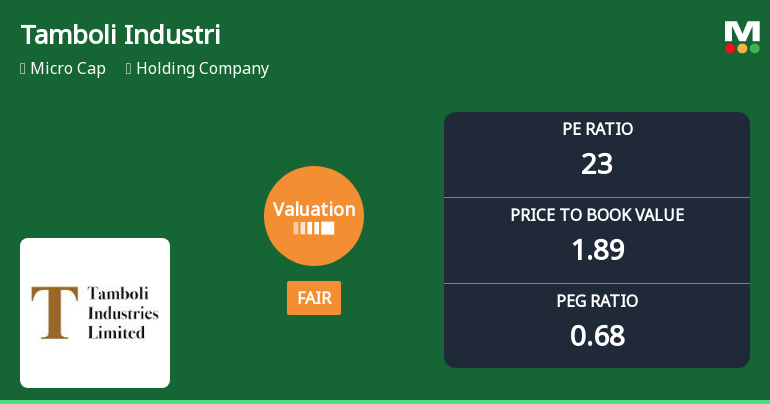
Tamboli Industries Ltd Valuation Shifts Signal Fair Price Amid Strong Market Outperformance
Tamboli Industries Ltd, a micro-cap holding company, has witnessed a notable shift in its valuation parameters, moving from an attractive to a fair rating. This change comes amid robust stock performance that has significantly outpaced the broader Sensex, prompting a reassessment of its price-to-earnings and price-to-book value multiples relative to historical and peer benchmarks.
Read full news article Announcements
Board Meeting Intimation for Intimation Regarding Meeting Of The Board Of Directors Will Be Held On FRIDAY July 31 2026
16-Jul-2026 | Source : BSETamboli Industries Ltdhas informed BSE that the meeting of the Board of Directors of the Company is scheduled on 31/07/2026 inter alia to consider and approve Un-audited Quarterly Financial Results of the Company for April-June 2026 quarter ended on June 30 2026.
Closure of Trading Window
26-Jun-2026 | Source : BSEIntimation regarding trading window closure for insider trading as required under the SEBI (Prohibition of Insider Trading) Regulation 2015
Audited Financial Results (Standalone And Consolidated) For January-March 2026 Quarter (Q4) And Financial Year Ended 31.03.2026.
07-May-2026 | Source : BSEAudited Financial Results (Standalone and Consolidated) for January-March 2026 quarter (Q4) and Financial Year ended 31.03.2026.
Corporate Actions

31 Jul 2026

Tamboli Industries Ltd has declared 10% dividend, ex-date: 25 Aug 25

No Splits history available

No Bonus history available

No Rights history available
Quality key factors
Valuation key factors
Technicals key factors
 Technical Indicator Scale: Bearish, Mildly Bearish, Sideways, Mildly Bullish, Bullish Turned
 Shareholding Snapshot : Jun 2026
Shareholding Compare (%holding)
Promoters
None
Held by 0 Schemes
Held by 0 FIIs
Tamboli Vaibhav Bipin (40.36%)
Manoj Dua (4.31%)
36.74%
Quarterly Results Snapshot (Consolidated) - Mar'26 - YoY

YoY Growth in quarter ended Mar 2026 is 14.90% vs 16.95% in Mar 2025
YoY Growth in quarter ended Mar 2026 is 63.35% vs 76.76% in Mar 2025
Half Yearly Results Snapshot (Consolidated) - Sep'25

Growth in half year ended Sep 2025 is 16.22% vs -19.62% in Sep 2024
Growth in half year ended Sep 2025 is 8.45% vs -23.32% in Sep 2024
Nine Monthly Results Snapshot (Consolidated) - Dec'25
YoY Growth in nine months ended Dec 2025 is 17.47% vs -15.48% in Dec 2024
YoY Growth in nine months ended Dec 2025 is 9.81% vs -14.89% in Dec 2024
Annual Results Snapshot (Consolidated) - Mar'26
YoY Growth in year ended Mar 2026 is 16.72% vs -8.19% in Mar 2025
YoY Growth in year ended Mar 2026 is 27.24% vs 2.39% in Mar 2025
About Tamboli Industries Ltd

Company Coordinates


