
Compare Shalimar Wires with Similar Stocks
Dashboard
High Debt company with Weak Long Term Fundamental Strength
- Poor long term growth as Net Sales has grown by an annual rate of 9.77% over the last 5 years
- High Debt Company with a Debt to Equity ratio (avg) of 2.47 times
- The company has been able to generate a Return on Equity (avg) of 4.95% signifying low profitability per unit of shareholders funds
45.03% of Promoter Shares are Pledged
Consistent Underperformance against the benchmark over the last 3 years
Stock DNA
Garments & Apparels
INR 77 Cr (Micro Cap)
10.00
15
0.00%
1.90
17.82%
1.76
Total Returns (Price + Dividend) 
Shalimar Wires for the last several years.
Risk Adjusted Returns v/s
Returns Beta

News

Shalimar Wires Industries Ltd is Rated Sell
Shalimar Wires Industries Ltd is rated 'Sell' by MarketsMOJO, with this rating last updated on 25 March 2026. However, the analysis and financial metrics discussed here reflect the stock's current position as of 17 June 2026, providing investors with an up-to-date view of the company’s fundamentals, valuation, financial trends, and technical outlook.
Read full news article
Shalimar Wires Industries Ltd is Rated Sell
Shalimar Wires Industries Ltd is rated 'Sell' by MarketsMOJO, with this rating last updated on 25 March 2026. However, the analysis and financial metrics discussed here reflect the stock's current position as of 08 June 2026, providing investors with an up-to-date view of the company’s fundamentals, returns, and market standing.
Read full news article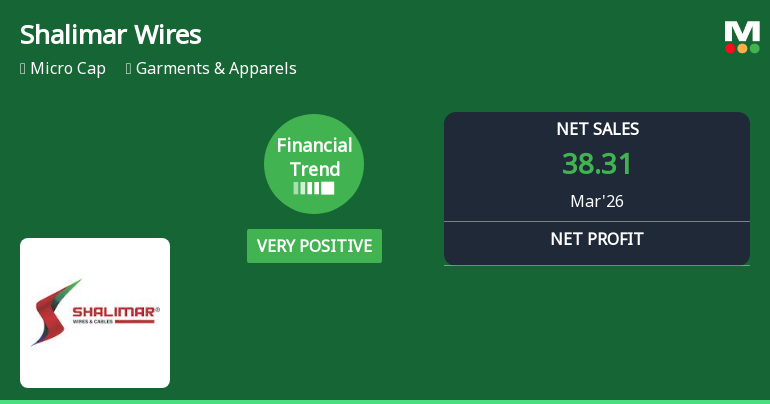
Shalimar Wires Industries Ltd Reports Very Positive Quarterly Financial Performance Amid Margin Expansion
Shalimar Wires Industries Ltd has demonstrated a marked turnaround in its financial trend for the quarter ended March 2026, registering its highest quarterly revenue and profit metrics in recent history. This improvement comes despite ongoing market challenges and a micro-cap status within the Garments & Apparels sector, signalling a potential shift in investor sentiment and operational efficiency.
Read full news article Announcements
Announcement under Regulation 30 (LODR)-Newspaper Publication
17-Jun-2026 | Source : BSENewspaper Advertisement for opening of Special Window for re-lodgment of transfer requests of physical shares
Announcement under Regulation 30 (LODR)-Newspaper Publication
10-Jun-2026 | Source : BSEEnclosed herewith please find the newspaper advertisement published on 9th June 2026 intimating the shareholders regarding 30th Annual General Meeting of the Company which is scheduled to be held on 30th June 2026 after completion of despatch of Notice of AGM and Annual Report for the Financial Year ended 31st March 2026.
Annual General Meeting Of The Company Will Be Held On 30Th June 2026 At 11:00 A.M. Through VC Or OAVM
08-Jun-2026 | Source : BSEThe Company has fixed 23rd June 2026 as the cut-off date to determine members who shall be entitled to cast their vote by electronic means at the forthcoming AGM of the Company scheduled to be held on 30th June 2026 at 11:00 A.M. through VC or OAVM.
Corporate Actions

No Upcoming Board Meetings

No Dividend history available

Shalimar Wires Industries Ltd has announced 2:10 stock split, ex-date: 23 Dec 10

No Bonus history available

No Rights history available
Quality key factors
Valuation key factors
Technicals key factors
 Technical Indicator Scale: Bearish, Mildly Bearish, Sideways, Mildly Bullish, Bullish Turned
 Shareholding Snapshot : Mar 2026
Shareholding Compare (%holding)
Promoters
45.0302
Held by 8 Schemes (0.0%)
Held by 0 FIIs
Sunita Khaitan (23.67%)
Asset Reconstruction Company (india) Ltd. (25.95%)
5.81%
Quarterly Results Snapshot (Standalone) - Mar'26 - QoQ

QoQ Growth in quarter ended Mar 2026 is 9.39% vs -2.64% in Dec 2025
QoQ Growth in quarter ended Mar 2026 is 129.70% vs -31.76% in Dec 2025
Half Yearly Results Snapshot (Standalone) - Sep'25
Growth in half year ended Sep 2025 is 6.37% vs -0.32% in Sep 2024
Growth in half year ended Sep 2025 is 135.85% vs -60.30% in Sep 2024
Nine Monthly Results Snapshot (Standalone) - Dec'25
YoY Growth in nine months ended Dec 2025 is 8.67% vs 1.39% in Dec 2024
YoY Growth in nine months ended Dec 2025 is 140.41% vs -7.01% in Dec 2024
Annual Results Snapshot (Standalone) - Mar'26
YoY Growth in year ended Mar 2026 is 7.77% vs 2.75% in Mar 2025
YoY Growth in year ended Mar 2026 is 148.72% vs 59.18% in Mar 2025
About Shalimar Wires Industries Ltd

Company Coordinates


