
Compare Deepak Spinners with Similar Stocks
Dashboard
Weak Long Term Fundamental Strength with a -34.44% CAGR growth in Operating Profits over the last 5 years
- The company has been able to generate a Return on Equity (avg) of 8.05% signifying low profitability per unit of shareholders funds
Consistent Underperformance against the benchmark over the last 3 years
Stock DNA
Garments & Apparels
INR 93 Cr (Micro Cap)
26.00
26
0.00%
0.13
1.59%
0.42
Total Returns (Price + Dividend) 
Latest dividend: 0.5 per share ex-dividend date: Aug-23-2024
Risk Adjusted Returns v/s
Returns Beta

News

Deepak Spinners Ltd. Downgraded to Sell Amid Mixed Financial and Technical Signals
Deepak Spinners Ltd., a micro-cap player in the Garments & Apparels sector, has seen its investment rating downgraded from Hold to Sell as of 14 July 2026. This change reflects a complex interplay of deteriorating technical indicators, subdued financial trends, and valuation metrics that, despite some positives, fail to offset the company’s weak long-term fundamentals and underperformance against benchmarks.
Read full news article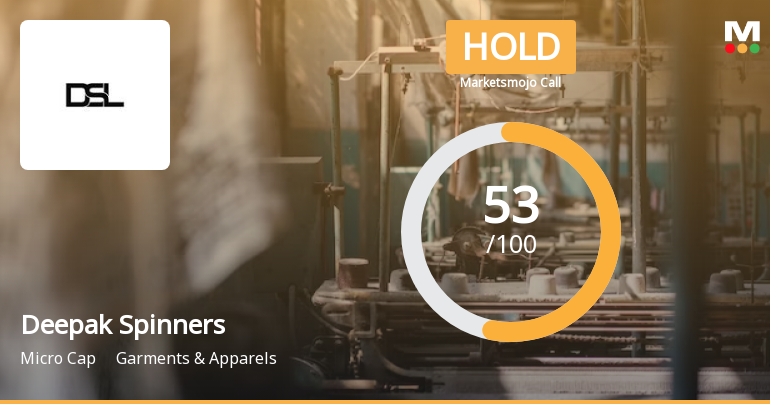
Deepak Spinners Ltd. is Rated Hold by MarketsMOJO
Deepak Spinners Ltd. is rated 'Hold' by MarketsMOJO, with this rating last updated on 25 June 2026. However, the analysis and financial metrics presented here reflect the stock's current position as of 07 July 2026, providing investors with the latest insights into its performance and outlook.
Read full news article
Deepak Spinners Ltd. Upgraded to Hold by MarketsMOJO on Technical Improvements
Deepak Spinners Ltd., a micro-cap player in the Garments & Apparels sector, has seen its investment rating upgraded from Sell to Hold as of 25 June 2026. This revision reflects a combination of improved technical indicators, positive quarterly financial results, and attractive valuation metrics despite lingering concerns over long-term fundamentals and relative underperformance against benchmarks.
Read full news article Announcements
Board Meeting Intimation for Considering And Approving Unaudited Financial Results For The Quarter Ended On 30.06.2026
16-Jul-2026 | Source : BSEDeepak Spinners Ltd-has informed BSE that the meeting of the Board of Directors of the Company is scheduled on 06/08/2026 inter alia to consider and approve Unaudited financial results for the quarter ended on 30.06.2026
Book Closure And Cut Off Date
16-Jul-2026 | Source : BSEAs annexed.
Compliances-Certificate under Reg. 74 (5) of SEBI (DP) Regulations 2018
14-Jul-2026 | Source : BSEAs annexed
Corporate Actions

06 Aug 2026

Deepak Spinners Ltd. has declared 5% dividend, ex-date: 23 Aug 24

No Splits history available

No Bonus history available

No Rights history available
Quality key factors
Valuation key factors
Technicals key factors
 Technical Indicator Scale: Bearish, Mildly Bearish, Sideways, Mildly Bullish, Bullish Turned
 Shareholding Snapshot : Mar 2026
Shareholding Compare (%holding)
Non Institution
None
Held by 1 Schemes (0.01%)
Held by 0 FIIs
Yashwant Kumar Daga (13.88%)
Iepfauthority Ministry Of Corporate Affairs (4.51%)
39.29%
Quarterly Results Snapshot (Standalone) - Mar'26 - QoQ

QoQ Growth in quarter ended Mar 2026 is -10.65% vs -3.09% in Dec 2025
QoQ Growth in quarter ended Mar 2026 is -12.10% vs 42.64% in Dec 2025
Half Yearly Results Snapshot (Standalone) - Sep'25
Growth in half year ended Sep 2025 is 2.82% vs 9.92% in Sep 2024

Growth in half year ended Sep 2025 is 81.96% vs -291.77% in Sep 2024
Nine Monthly Results Snapshot (Standalone) - Dec'25
YoY Growth in nine months ended Dec 2025 is 2.69% vs 11.12% in Dec 2024
YoY Growth in nine months ended Dec 2025 is 112.26% vs -325.53% in Dec 2024
Annual Results Snapshot (Standalone) - Mar'26
YoY Growth in year ended Mar 2026 is 1.93% vs 11.27% in Mar 2025
YoY Growth in year ended Mar 2026 is 135.72% vs -883.85% in Mar 2025
About Deepak Spinners Ltd.

Company Coordinates


