
Compare Rapid Invest. with Similar Stocks
Stock DNA
Diversified Commercial Services
INR 21 Cr (Micro Cap)
39.00
21
0.00%
0.00
4.73%
1.85
Total Returns (Price + Dividend) 
Rapid Invest. for the last several years.
Risk Adjusted Returns v/s
Returns Beta

News
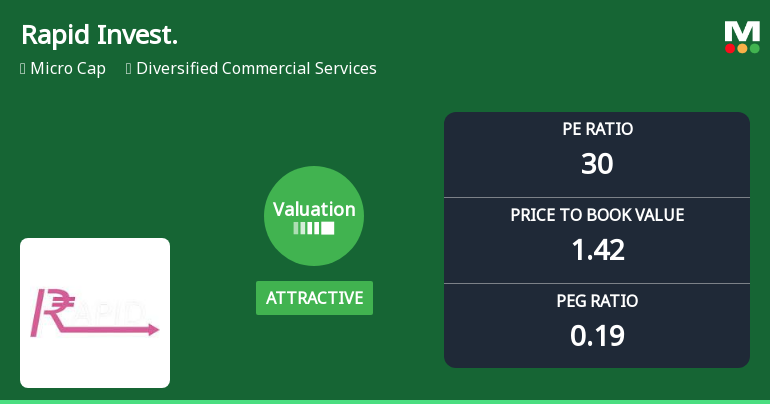
Rapid Investments Ltd Valuation Shifts Signal Changing Market Sentiment
Rapid Investments Ltd, a micro-cap player in the Diversified Commercial Services sector, has seen a notable shift in its valuation parameters, moving from a very attractive to an attractive rating. Despite a recent strong daily price gain of 5.00%, the company’s longer-term returns remain subdued compared to the broader market, prompting a detailed analysis of its price-to-earnings (P/E) and price-to-book value (P/BV) ratios in relation to historical and peer benchmarks.
Read full news article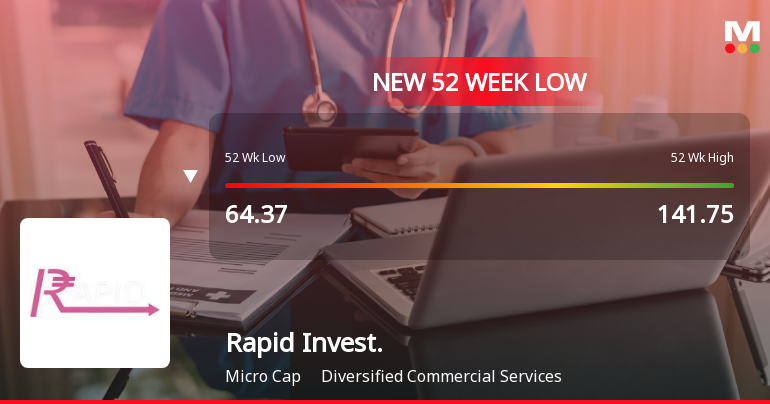
Rapid Investments Ltd Falls to 52-Week Low of Rs 59 as Sell-Off Deepens
A sharp decline has pushed Rapid Investments Ltd to a fresh 52-week low of Rs 59 on 1 Apr 2026, marking a significant 58.4% drop from its peak of Rs 141.75 within the last year. This steep fall comes amid a backdrop of persistent underperformance and weak operating results, despite some positive signals in profitability metrics.
Read full news article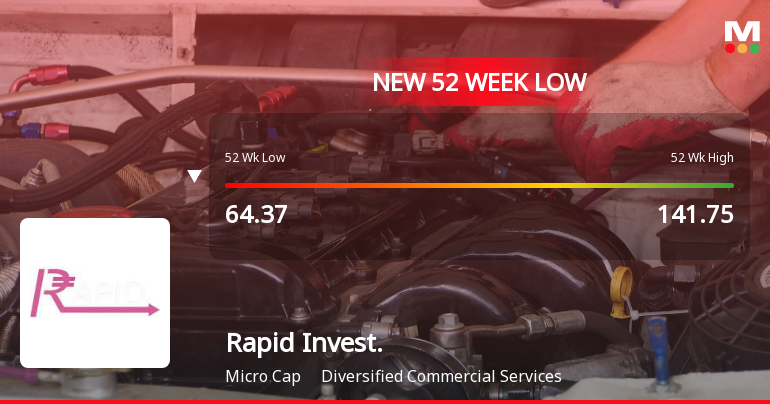
Rapid Investments Ltd Falls to 52-Week Low of Rs 59.56 as Sell-Off Deepens
A sharp decline of 4.99% today dragged Rapid Investments Ltd to a fresh 52-week low of Rs 59.56, extending a downward trend that has seen the stock lose over 41% in the past year. This underperformance stands in stark contrast to the broader market, with the Sensex down just 5.18% over the same period.
Read full news article Announcements
Format of the Annual Disclosure to be made by an entity identified as a LC - Annexure B2
25-Apr-2026 | Source : BSEFormat of the Annual Disclosure to be made by an entity identified as a Large Corporate.
| Sr. No. | Particulars | Details |
| 1 | Name of Company | Rapid Investments Ltd |
| 2 | CIN NO. | L65990MH1978PLC020387 |
| 3 | Report filed for FY | 2025-2026 |
| Details of the Current block (all figures in Rs crore): | ||
| 4 | 2 - year block period (Specify financial years)* | 2024-25 & 2025-26 |
| 5 | Incremental borrowing done in FY (T)(a) | 0.00 |
| 6 | Mandatory borrowing to be done through debt securities in FY (T) (b) = (25% of a) | 0.00 |
| 7 | Actual borrowing done through debt securities in FY (T)(c) | 0.00 |
| 8 | Shortfall in the borrowing through debt securities if any for FY (T - 1) carried forward to FY (T) (d) | 0 |
| 8 | Quantum of (d) which has been met from (c)(e)* | 0 |
| 9 | Shortfall if any in the mandatory borrowing through debt securities for FY (T) { after adjusting for any shortfall in borrowing for FY(T - 1) which was carried forward to FY(T)}(f) = (b) - [(c) - (e)]{ If the calculated value is zero or negative write nil}* | 0 |
| Details of penalty to be paid if any in respect to previous block (all figures in Rs crore): | |
| 2 - year Block period (Specify financial years) | 2024-25 & 2025-26 |
| Amount of fine to be paid for the block if applicable Fine = 0.2% of {(d) - (e)}# | 0.00 |
| Name of the Company Secretary :- | VIJAY DALPATBHAI TERAIYA |
| Designation :- | COMPANY SECRETARY AND COMPLIANCE OFFICER |
| Name of the Chief Financial Officer :- | SHAILENDRA T SINGH |
| Designation : - | CFO |
Date: 25/04/2026
Format of the Initial Disclosure to be made by an entity identified as a Large Corporate : Annexure A
25-Apr-2026 | Source : BSEFormat of Initial Disclosure to be made by an entity identified as a Large Corporate.
| Sr. No. | Particulars | Details |
| 1 | Name of Company | Rapid Investments Ltd |
| 2 | CIN NO. | L65990MH1978PLC020387 |
| 3 | Outstanding borrowing of company as on 31st March / 31st December as applicable (in Rs cr) | 0.00 |
| 4 | Highest Credit Rating during the previous FY | NA |
| 4a | Name of the Credit Rating Agency issuing the Credit Rating mentioned in (4) | Not Applicable |
| 5 | Name of Stock Exchange# in which the fine shall be paid in case of shortfall in the required borrowing under the framework | BSE |
Designation: Company Secretary and Compliance Officer
EmailId: rapidinvestor@gmail.com
Designation: CFO
EmailId: rapidinvestor@gmail.com
Date: 25/04/2026
Note: In terms para of 3.2(ii) of the circular beginning F.Y 2022 in the event of shortfall in the mandatory borrowing through debt securities a fine of 0.2% of the shortfall shall be levied by Stock Exchanges at the end of the two-year block period. Therefore an entity identified as LC shall provide in its initial disclosure for a financial year the name of Stock Exchange to which it would pay the fine in case of shortfall in the mandatory borrowing through debt markets.
Reply To Clarification On Price Movement Sought By BSE Limited Dated 21.04.2026.
21-Apr-2026 | Source : BSEWith reference to the clarification sought by BSE on 21st April 2026 on significant movement in price we would like to inform that the company is regular in informing BSE about whatever internal developments occuring as per LODR guidelines. We have already informed BSE Ltd. about the un-audited finncial results for thr quarter ended 31st December 2025 on 12th February 2026. As regards significant price movement in the price of the companys shares in the recent past we have to inform you that the promoters & their relatives & KMPs of the company ave not bought and sold the companys shares during the last 15 days period. Kindly take the above in your record and acknowledge receipt of the same.
Corporate Actions

No Upcoming Board Meetings

Rapid Investments Ltd has declared 5% dividend, ex-date: 31 Aug 17

No Splits history available

No Bonus history available

Rapid Investments Ltd has announced 25:39 rights issue, ex-date: 17 Sep 24
Quality key factors
Valuation key factors
Technicals key factors
 Technical Indicator Scale: Bearish, Mildly Bearish, Sideways, Mildly Bullish, Bullish Turned
 Shareholding Snapshot : Mar 2026
Shareholding Compare (%holding)
Promoters
None
Held by 0 Schemes
Held by 0 FIIs
Reliable Holdings Private Limited (42.13%)
Solution Commercials India Pvt Ltd (9.03%)
12.73%
Quarterly Results Snapshot (Standalone) - Dec'25 - QoQ

QoQ Growth in quarter ended Dec 2025 is -12.50% vs -27.27% in Sep 2025

QoQ Growth in quarter ended Dec 2025 is -84.62% vs -18.75% in Sep 2025
Half Yearly Results Snapshot (Standalone) - Sep'25
Growth in half year ended Sep 2025 is 31.51% vs -19.78% in Sep 2024
Growth in half year ended Sep 2025 is 314.29% vs -22.22% in Sep 2024
Nine Monthly Results Snapshot (Standalone) - Dec'25
YoY Growth in nine months ended Dec 2025 is 3.97% vs -8.03% in Dec 2024
YoY Growth in nine months ended Dec 2025 is 138.46% vs 8.33% in Dec 2024
Annual Results Snapshot (Standalone) - Mar'25
YoY Growth in year ended Mar 2025 is -4.66% vs 522.58% in Mar 2024
YoY Growth in year ended Mar 2025 is 80.00% vs 566.67% in Mar 2024
About Rapid Investments Ltd

Company Coordinates


