
Compare Sawaca Enterpri. with Similar Stocks
Dashboard
With a Operating Losses, the company has a Weak Long Term Fundamental Strength
- Company's ability to service its debt is weak with a poor EBIT to Interest (avg) ratio of -0.86
- The company has reported losses. Due to this company has reported negative ROCE
Flat results in Mar 26
Risky - Negative EBITDA
Stock DNA
Diversified Commercial Services
INR 17 Cr (Micro Cap)
NA (Loss Making)
23
0.00%
0.04
-0.72%
0.30
Total Returns (Price + Dividend) 
Sawaca Enterpri. for the last several years.
Risk Adjusted Returns v/s
Returns Beta

News
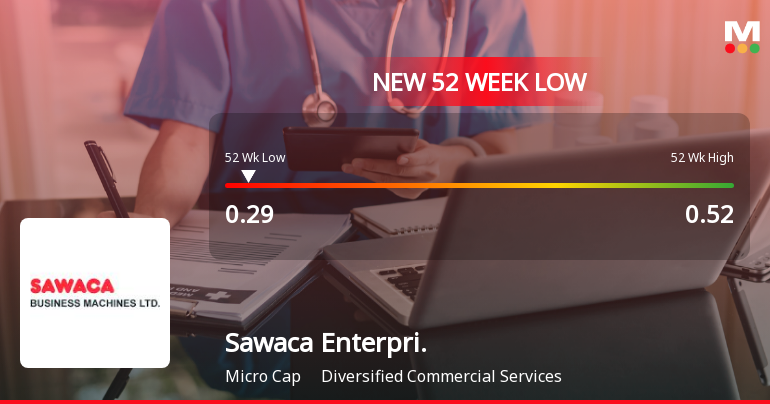
Sawaca Enterprises Ltd Falls to 52-Week Low of Rs 0.29 as Sell-Off Deepens
For the fifth consecutive session, Sawaca Enterprises Ltd closed lower, slipping to a fresh 52-week low of Rs 0.29 on 16 Jun 2026. This decline comes amid a broader market rally, with the Sensex trading 0.56% higher, highlighting a stark divergence in the stock's performance.
Read full news articleAre Sawaca Enterprises Ltd latest results good or bad?
Sawaca Enterprises Ltd's latest financial results for Q4 FY26 present a complex picture characterized by significant revenue growth alongside substantial operational challenges. The company reported net sales of ₹12.37 crores, reflecting an 8.22% sequential increase and a notable 28.05% year-on-year growth. This marks the highest quarterly revenue in recent periods, indicating some commercial traction. However, this revenue expansion has not translated into profitability, as the company incurred a net loss of ₹1.06 crores, which is a stark contrast to the positive net profit of ₹0.41 crores reported in the previous quarter (Q3 FY26). The operational metrics reveal a concerning trend, with the operating margin deteriorating to -2.83% from -0.44% in Q3 FY26, and the profit after tax (PAT) margin collapsing to -8.57% from a positive 3.59%. This indicates a significant erosion of profitability, raising questio...
Read full news article
Sawaca Enterprises Q4 FY26: Mounting Losses Signal Deepening Operational Crisis
Sawaca Enterprises Ltd., a micro-cap diversified commercial services company, reported a troubling fourth quarter for FY26, posting a net loss of ₹1.06 crores—a stark deterioration from the ₹0.41 crore profit recorded in Q3 FY26. The loss represents a sequential decline of 358.54% and a year-on-year worsening of 39.08% compared to the ₹1.74 crore loss in Q4 FY25. The company's stock, trading at ₹0.35 on the NSE with a market capitalisation of just ₹21.00 crores, has declined 2.78% following the results announcement, reflecting investor concerns about the deteriorating financial trajectory.
Read full news article Announcements
Compliances-Certificate under Reg. 74 (5) of SEBI (DP) Regulations 2018
08-Jul-2026 | Source : BSEThe Certificate under 74(5) of the SEBI(DP) Reg. 2018 as received from the RTA for the quarter ended June 302026 is enclosed.
Closure of Trading Window
29-Jun-2026 | Source : BSEClosure of Trading Window from 01st July 2026 untill 48 hrs after the decelaration of Unaudited Financial Result for the Quarter Ended June 302026.
Announcement under Regulation 30 (LODR)-Newspaper Publication
30-May-2026 | Source : BSEEnclosed the newspaper publication of the Audited Financial Results for the Year and Quarter ended March 31 2026.
Corporate Actions

No Upcoming Board Meetings

No Dividend history available

Sawaca Enterprises Ltd has announced 1:10 stock split, ex-date: 27 May 22

Sawaca Enterprises Ltd has announced 10:100 bonus issue, ex-date: 27 May 22

Sawaca Enterprises Ltd has announced 4:1 rights issue, ex-date: 07 Mar 24
Quality key factors
Valuation key factors
Technicals key factors
 Technical Indicator Scale: Bearish, Mildly Bearish, Sideways, Mildly Bullish, Bullish Turned
 Shareholding Snapshot : Jun 2026
Shareholding Compare (%holding)
Non Institution
None
Held by 0 Schemes
Held by 0 FIIs
Jyotsana Satishkumar Shah (0.37%)
Thulasibabu Karjala Rajasekhar (1.75%)
94.66%
Quarterly Results Snapshot (Standalone) - Mar'26 - YoY

YoY Growth in quarter ended Mar 2026 is 28.05% vs 60.20% in Mar 2025

YoY Growth in quarter ended Mar 2026 is 39.08% vs -17,500.00% in Mar 2025
Half Yearly Results Snapshot (Standalone) - Sep'25
Growth in half year ended Sep 2025 is -70.48% vs 9,311.76% in Sep 2024
Growth in half year ended Sep 2025 is -69.23% vs 122.86% in Sep 2024
Nine Monthly Results Snapshot (Standalone) - Dec'25
YoY Growth in nine months ended Dec 2025 is -64.73% vs 14,133.33% in Dec 2024
YoY Growth in nine months ended Dec 2025 is -53.24% vs 208.89% in Dec 2024
Annual Results Snapshot (Standalone) - Mar'26
YoY Growth in year ended Mar 2026 is -53.84% vs 1,157.65% in Mar 2025
YoY Growth in year ended Mar 2026 is -17.14% vs -176.09% in Mar 2025
About Sawaca Enterprises Ltd

Company Coordinates


