
Compare Tradewell Hold with Similar Stocks
Stock DNA
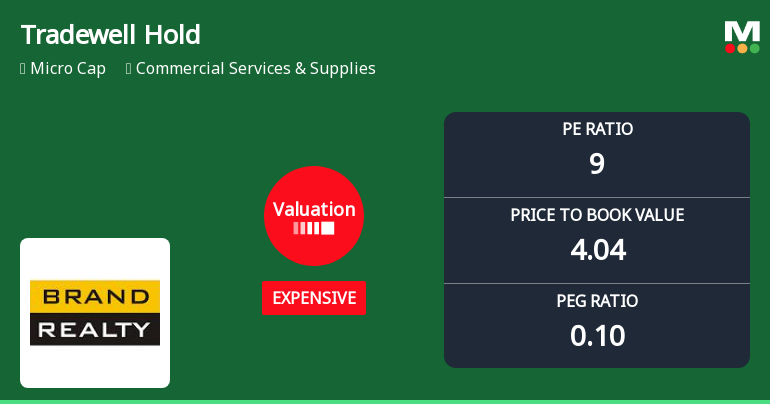
Commercial Services & Supplies
INR 21 Cr (Micro Cap)
8.00
21
0.00%
1.75
43.17%
3.61
Total Returns (Price + Dividend) 
Tradewell Hold for the last several years.
Risk Adjusted Returns v/s
Returns Beta

News
Tradewell Holdings Ltd Valuation Shifts Signal Price Attractiveness Challenges
Tradewell Holdings Ltd, a micro-cap player in the Commercial Services & Supplies sector, has seen a notable shift in its valuation parameters, moving from fair to expensive territory. This change, reflected in its price-to-earnings (P/E) and price-to-book value (P/BV) ratios, marks a significant development for investors assessing the stock’s price attractiveness amid mixed financial signals and sector comparisons.
Read full news article
Tradewell Holdings Ltd Valuation Shifts to Fair Amid Mixed Market Performance
Tradewell Holdings Ltd, a micro-cap player in the Commercial Services & Supplies sector, has seen a notable shift in its valuation parameters, moving from an expensive to a fair valuation grade. This change is underpinned by its current price-to-earnings (P/E) ratio of 8.91 and price-to-book value (P/BV) of 3.85, which now position the stock as more price-attractive relative to its historical and peer averages. Despite a recent downgrade in its Mojo Grade from Hold to Sell, the stock’s valuation metrics warrant a closer examination for investors seeking value opportunities in the sector.
Read full news article
Tradewell Holdings Ltd Downgraded to Sell Amid Mixed Financial and Technical Signals
Tradewell Holdings Ltd, a micro-cap player in the Commercial Services & Supplies sector, has seen its investment rating downgraded from Hold to Sell as of 15 April 2026. This shift reflects a complex interplay of factors including technical trend moderation, valuation pressures, financial performance nuances, and quality assessments, signalling caution for investors despite recent market-beating returns.
Read full news article Announcements
Non Applicability Of Initial Disclosure And Annual Disclosure With Respect To Large Corporate Framework As Specified By SEBI Vide Circular No. SEBI/HO/DDHS/Clr/P/2018/144 Dated 26Th November 2018 Read With Circular No. SEBI/HO/DDHS/DDHSRACPOD1/P/CIR/2023/
30-Apr-2026 | Source : BSEPlease find attached herewith non applicability of initial & annual disclosures in respect of fund raising by issuance of debt by large entities
Compliances-Certificate under Reg. 74 (5) of SEBI (DP) Regulations 2018
10-Apr-2026 | Source : BSEPlease find attached herewith certificate under reg 74(5) of SEBI (DP) Regulations 2018 as received from RTA
Disclosure Under Regulation 31(4) Of SEBI (Substantial Acquisition Of Shares And Takeovers ) Regulation 2011
06-Apr-2026 | Source : BSEPlease find attached herewith annual disclosure U/R 31(4) SAST Regulation 2011 for the FY ended 31st March 2026 received from promoter & promoters group of the Company
Corporate Actions

No Upcoming Board Meetings

No Dividend history available

No Splits history available

No Bonus history available

No Rights history available
Quality key factors
Valuation key factors
Technicals key factors
 Technical Indicator Scale: Bearish, Mildly Bearish, Sideways, Mildly Bullish, Bullish Turned
 Shareholding Snapshot : Dec 2025
Shareholding Compare (%holding)
Promoters
None
Held by 0 Schemes
Held by 0 FIIs
Kamal Manchanda (48.02%)
Rashmi Gupta (9.5%)
21.45%
Quarterly Results Snapshot (Standalone) - Dec'25 - YoY

YoY Growth in quarter ended Dec 2025 is 0.00% vs -100.00% in Dec 2024
YoY Growth in quarter ended Dec 2025 is 124.07% vs -417.65% in Dec 2024
Half Yearly Results Snapshot (Standalone) - Sep'25

Growth in half year ended Sep 2025 is -96.46% vs 1,550.00% in Sep 2024
Growth in half year ended Sep 2025 is 405.45% vs -1,733.33% in Sep 2024
Nine Monthly Results Snapshot (Standalone) - Dec'25
YoY Growth in nine months ended Dec 2025 is -86.99% vs 633.33% in Dec 2024
YoY Growth in nine months ended Dec 2025 is 266.06% vs -878.57% in Dec 2024
Annual Results Snapshot (Standalone) - Mar'25
YoY Growth in year ended Mar 2025 is -69.70% vs 2,713.68% in Mar 2024
YoY Growth in year ended Mar 2025 is -115.38% vs 717.50% in Mar 2024
About Tradewell Holdings Ltd

Company Coordinates


