
Compare Centum Electron with Similar Stocks
Dashboard
With a growth in Net Sales of 27.46%, the company declared Very Positive results in Mar 26
- The company has declared positive results for the last 2 consecutive quarters
- PAT(Latest six months) Higher at Rs 59.79 cr
- ROCE(HY) Highest at 53.54%
- OPERATING PROFIT TO INTEREST(Q) Highest at 9.82 times
High Institutional Holdings at 23.88%
Market Beating performance in long term as well as near term
Stock DNA
Industrial Manufacturing
INR 5,458 Cr (Small Cap)
74.00
54
0.17%
0.01
20.50%
15.18
Total Returns (Price + Dividend) 
Latest dividend: 6 per share ex-dividend date: Jul-25-2025
Risk Adjusted Returns v/s
Returns Beta

News
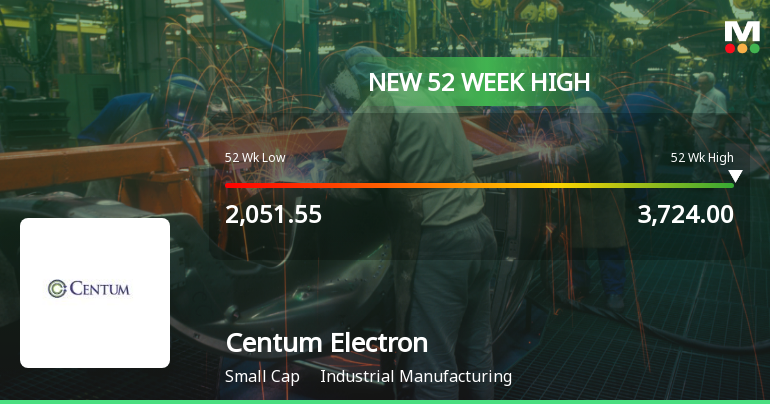
Broad-Based Technical Strength Lifts Centum Electronics Ltd to 52-Week High of Rs 3724
With a remarkable 63.7% gain over the past year, Centum Electronics Ltd has surged to a fresh 52-week high of Rs 3724, just 1.7% above its current close. This milestone caps a sustained rally fuelled by a confluence of robust technical indicators and strong price momentum, setting the stock apart in the industrial manufacturing sector.
Read full news article
Broad-Based Technical Strength Lifts Centum Electronics Ltd to 52-Week High of Rs 3724
Surging to an all-time high of Rs 3724 on 15 Jun 2026, Centum Electronics Ltd has demonstrated remarkable price momentum, outpacing its sector and the broader market with a 64.66% gain over the past year against the Sensex’s decline of 5.77%.
Read full news article
Centum Electronics Ltd is Rated Buy
Centum Electronics Ltd is rated Buy by MarketsMOJO, with this rating last updated on 16 May 2026. However, the analysis and financial metrics presented here reflect the stock’s current position as of 15 June 2026, providing investors with the most up-to-date view of the company’s fundamentals, returns, and market performance.
Read full news article Announcements
Announcement under Regulation 30 (LODR)-Newspaper Publication
11-Jun-2026 | Source : BSEAnnouncement under Regulation 30 (LODR)- Newspaper Publication.
Announcement under Regulation 30 (LODR)-Restructuring
11-Jun-2026 | Source : BSEPlease refer enclosed
Disclosures under Reg. 29(2) of SEBI (SAST) Regulations 2011
29-May-2026 | Source : BSEThe Exchange has received the disclosure under Regulation 29(2) of SEBI (Substantial Acquisition of Shares & Takeovers) Regulations 2011 for M S Swarnakumari
Corporate Actions

No Upcoming Board Meetings

Centum Electronics Ltd has declared 60% dividend, ex-date: 25 Jul 25

No Splits history available

No Bonus history available

No Rights history available
Quality key factors
Valuation key factors
Technicals key factors
 Technical Indicator Scale: Bearish, Mildly Bearish, Sideways, Mildly Bullish, Bullish Turned
 Shareholding Snapshot : Mar 2026
Shareholding Compare (%holding)
Promoters
None
Held by 2 Schemes (10.16%)
Held by 30 FIIs (2.37%)
Apparao Venkata Mallavarapu (35.49%)
Hdfc Mutual Fund - Hdfc Multi Cap Fund (9.55%)
20.58%
Quarterly Results Snapshot (Consolidated) - Mar'26 - YoY

YoY Growth in quarter ended Mar 2026 is 27.46% vs -10.04% in Mar 2025

YoY Growth in quarter ended Mar 2026 is -92.38% vs 412.03% in Mar 2025
Half Yearly Results Snapshot (Consolidated) - Sep'25
Growth in half year ended Sep 2025 is 11.61% vs 1.94% in Sep 2024
Growth in half year ended Sep 2025 is 309.38% vs -33.76% in Sep 2024
Nine Monthly Results Snapshot (Consolidated) - Dec'25
YoY Growth in nine months ended Dec 2025 is 2.91% vs -1.96% in Dec 2024
YoY Growth in nine months ended Dec 2025 is -127.37% vs -666.67% in Dec 2024
Annual Results Snapshot (Consolidated) - Mar'26
YoY Growth in year ended Mar 2026 is 28.70% vs -32.14% in Mar 2025
YoY Growth in year ended Mar 2026 is -2,584.46% vs 30.07% in Mar 2025
About Centum Electronics Ltd

Company Coordinates


