
Compare Sudal Industries with Similar Stocks
Dashboard
Weak Long Term Fundamental Strength with a 12.21% CAGR growth in Operating Profits over the last 5 years
- Company's ability to service its debt is weak with a poor EBIT to Interest (avg) ratio of 1.29
- The company has been able to generate a Return on Equity (avg) of 4.58% signifying low profitability per unit of shareholders funds
Flat results in Mar 26
82.28% of Promoter Shares are Pledged
Underperformed the market in the last 1 year
Stock DNA
Non - Ferrous Metals
INR 30 Cr (Micro Cap)
NA (Loss Making)
11
0.00%
0.61
-3.90%
1.24
Total Returns (Price + Dividend) 
Latest dividend: 1 per share ex-dividend date: Sep-13-2013
Risk Adjusted Returns v/s
Returns Beta

News
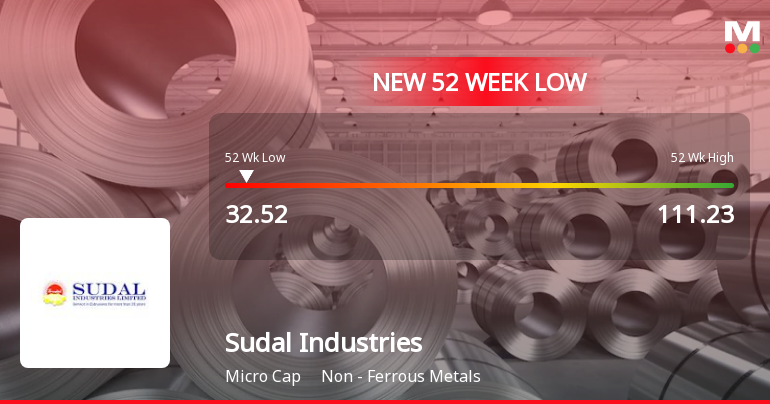
Sudal Industries Ltd Falls to 52-Week Low of Rs 32.52 as Sell-Off Deepens
For the fourth consecutive session, Sudal Industries Ltd has closed lower, culminating in a fresh 52-week low of Rs 32.52 on 2 Jul 2026. This marks a 14.56% decline over the past four days, underscoring persistent selling pressure despite a broadly rising market backdrop.
Read full news article
Sudal Industries Ltd Falls to 52-Week Low of Rs 32.7 as Sell-Off Deepens
For the third consecutive session, Sudal Industries Ltd has seen its share price decline, culminating in a fresh 52-week low of Rs 32.7 on 1 Jul 2026. This marks a steep 58.33% drop over the past year, significantly underperforming the Sensex's modest 8.17% decline over the same period.
Read full news article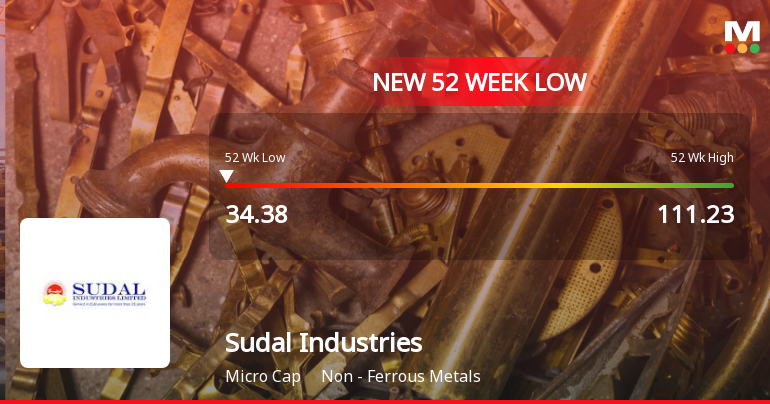
Announcements
Closure of Trading Window
24-Jun-2026 | Source : BSEPlease find enclosed intimation for Trading Window Closure
Announcement under Regulation 30 (LODR)-Newspaper Publication
01-Jun-2026 | Source : BSEPlease find enclosed.
Board Meeting Outcome for Audited Financial Results For The Quarter And Financial Year Ended 31St March 2026
30-May-2026 | Source : BSEPlease find eclosed Audited Financial Results for the Quarter and Financial Year ended 31st March 2026
Corporate Actions

No Upcoming Board Meetings

Sudal Industries Ltd has declared 10% dividend, ex-date: 13 Sep 13

No Splits history available

No Bonus history available

No Rights history available
Quality key factors
Valuation key factors
Technicals key factors
 Technical Indicator Scale: Bearish, Mildly Bearish, Sideways, Mildly Bullish, Bullish Turned
 Shareholding Snapshot : Mar 2026
Shareholding Compare (%holding)
Promoters
82.2789
Held by 0 Schemes
Held by 0 FIIs
Shyantanu Sudarshan Chokhani (32.48%)
Reynolds International Inc (3.89%)
25.18%
Quarterly Results Snapshot (Standalone) - Mar'26 - QoQ

QoQ Growth in quarter ended Mar 2026 is 8.94% vs 0.93% in Dec 2025
QoQ Growth in quarter ended Mar 2026 is 122.57% vs -495.38% in Dec 2025
Half Yearly Results Snapshot (Standalone) - Sep'25
Growth in half year ended Sep 2025 is 23.55% vs -7.76% in Sep 2024
Growth in half year ended Sep 2025 is -56.38% vs -97.98% in Sep 2024
Nine Monthly Results Snapshot (Standalone) - Dec'25
YoY Growth in nine months ended Dec 2025 is 19.37% vs 1.23% in Dec 2024

YoY Growth in nine months ended Dec 2025 is -163.18% vs -98.01% in Dec 2024
Annual Results Snapshot (Standalone) - Mar'26
YoY Growth in year ended Mar 2026 is 17.29% vs 7.38% in Mar 2025
YoY Growth in year ended Mar 2026 is -115.96% vs -95.30% in Mar 2025
About Sudal Industries Ltd

Company Coordinates


