
Compare Sudal Industries with Similar Stocks
Dashboard
Weak Long Term Fundamental Strength with a 12.21% CAGR growth in Operating Profits over the last 5 years
- Company's ability to service its debt is weak with a poor EBIT to Interest (avg) ratio of 1.29
- The company has been able to generate a Return on Equity (avg) of 4.58% signifying low profitability per unit of shareholders funds
Flat results in Mar 26
82.28% of Promoter Shares are Pledged
Underperformed the market in the last 1 year
Stock DNA
Non - Ferrous Metals
INR 30 Cr (Micro Cap)
NA (Loss Making)
12
0.00%
0.61
-3.90%
1.26
Total Returns (Price + Dividend) 
Latest dividend: 1 per share ex-dividend date: Sep-13-2013
Risk Adjusted Returns v/s
Returns Beta

News
Sudal Industries Ltd is Rated Strong Sell
Sudal Industries Ltd is rated Strong Sell by MarketsMOJO. This rating was last updated on 01 June 2026, reflecting a reassessment of the stock’s outlook. However, all fundamentals, returns, and financial metrics discussed here are current as of 09 July 2026, providing investors with the latest perspective on the company’s position.
Read full news article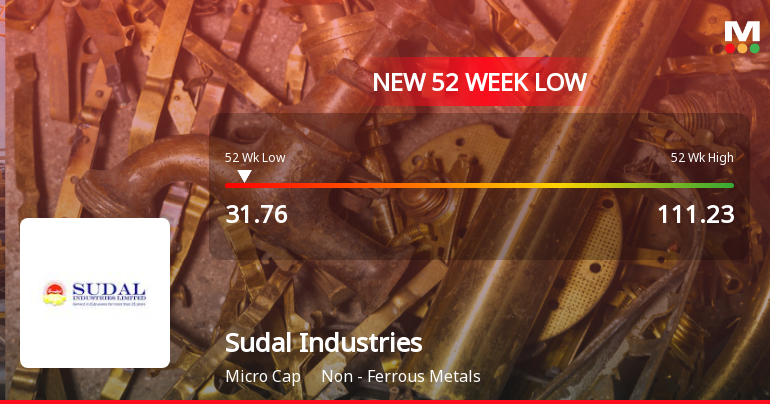
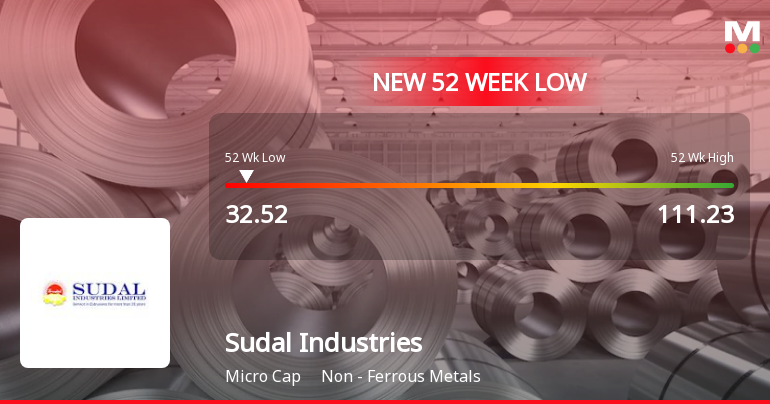
Sudal Industries Ltd Falls to 52-Week Low of Rs 32.52 as Sell-Off Deepens
For the fourth consecutive session, Sudal Industries Ltd has closed lower, culminating in a fresh 52-week low of Rs 32.52 on 2 Jul 2026. This marks a 14.56% decline over the past four days, underscoring persistent selling pressure despite a broadly rising market backdrop.
Read full news article Announcements
Compliances-Certificate under Reg. 74 (5) of SEBI (DP) Regulations 2018
09-Jul-2026 | Source : BSEPlease find enclosed Certificate under Regulation 74 (5) of SEBI (DP) Regulations 2018 for June 2026 Quarter.
Closure of Trading Window
24-Jun-2026 | Source : BSEPlease find enclosed intimation for Trading Window Closure
Announcement under Regulation 30 (LODR)-Newspaper Publication
01-Jun-2026 | Source : BSEPlease find enclosed.
Corporate Actions

No Upcoming Board Meetings

Sudal Industries Ltd has declared 10% dividend, ex-date: 13 Sep 13

No Splits history available

No Bonus history available

No Rights history available
Quality key factors
Valuation key factors
Technicals key factors
 Technical Indicator Scale: Bearish, Mildly Bearish, Sideways, Mildly Bullish, Bullish Turned
 Shareholding Snapshot : Mar 2026
Shareholding Compare (%holding)
Promoters
82.2789
Held by 0 Schemes
Held by 0 FIIs
Shyantanu Sudarshan Chokhani (32.48%)
Reynolds International Inc (3.89%)
25.18%
Quarterly Results Snapshot (Standalone) - Mar'26 - QoQ

QoQ Growth in quarter ended Mar 2026 is 8.94% vs 0.93% in Dec 2025
QoQ Growth in quarter ended Mar 2026 is 122.57% vs -495.38% in Dec 2025
Half Yearly Results Snapshot (Standalone) - Sep'25
Growth in half year ended Sep 2025 is 23.55% vs -7.76% in Sep 2024
Growth in half year ended Sep 2025 is -56.38% vs -97.98% in Sep 2024
Nine Monthly Results Snapshot (Standalone) - Dec'25
YoY Growth in nine months ended Dec 2025 is 19.37% vs 1.23% in Dec 2024

YoY Growth in nine months ended Dec 2025 is -163.18% vs -98.01% in Dec 2024
Annual Results Snapshot (Standalone) - Mar'26
YoY Growth in year ended Mar 2026 is 17.29% vs 7.38% in Mar 2025
YoY Growth in year ended Mar 2026 is -115.96% vs -95.30% in Mar 2025
About Sudal Industries Ltd

Company Coordinates


