
Compare Chennai Ferrous with Similar Stocks
Stock DNA
Non - Ferrous Metals
INR 33 Cr (Micro Cap)
10.00
26
0.00%
-0.06
6.29%
0.61
Total Returns (Price + Dividend) 
Chennai Ferrous for the last several years.
Risk Adjusted Returns v/s
Returns Beta

News
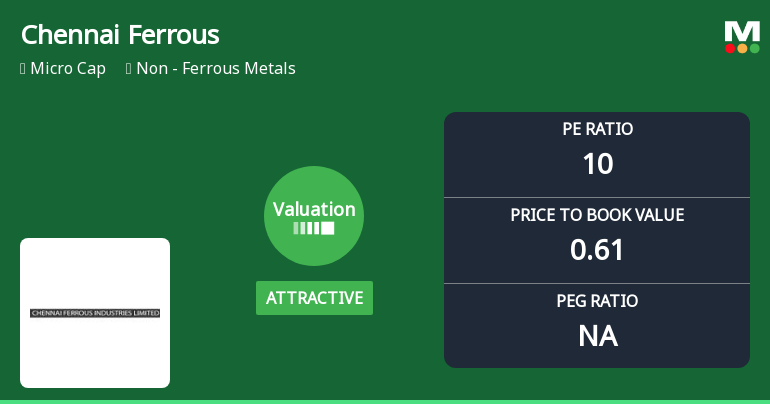
Chennai Ferrous Industries Ltd Valuation Shifts Signal Renewed Price Attractiveness
Chennai Ferrous Industries Ltd has witnessed a notable shift in its valuation parameters, moving from a fair to an attractive valuation grade, despite ongoing challenges reflected in its recent returns and market performance. This recalibration in price-to-earnings and price-to-book ratios, alongside peer comparisons, offers investors a nuanced perspective on the stock’s price attractiveness within the non-ferrous metals sector.
Read full news articleAre Chennai Ferrous Industries Ltd latest results good or bad?
Chennai Ferrous Industries Ltd's latest financial results for Q4 FY26 reveal significant operational challenges. The company reported net sales of ₹5.85 crores, reflecting a substantial year-on-year decline of 89.79% from ₹57.32 crores in the same quarter last year. This sharp drop highlights severe difficulties in maintaining trading volumes in its core coal and iron products business. In terms of profitability, the company reported a net profit of ₹1.98 crores, which is misleading as it was primarily driven by a one-time tax reversal of ₹2.00 crores. Without this extraordinary item, the company would have faced an operating loss of ₹0.81 crores, resulting in a deeply negative operating margin of -13.85%. This margin contrasts unfavorably with the marginally positive operating margin of 0.65% reported in Q4 FY25, indicating a deterioration in operational efficiency. The financial performance also shows a...
Read full news article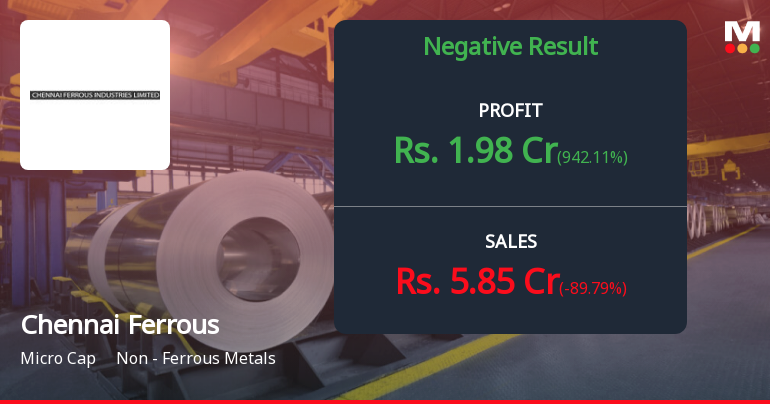
Chennai Ferrous Industries Q4 FY26: Revenue Collapse Masks Tax Reversal Windfall
Chennai Ferrous Industries Ltd., a micro-cap coal and iron trading company with a market capitalisation of ₹35.00 crores, reported a perplexing Q4 FY26 performance characterised by an 89.79% revenue collapse yet positive net profit of ₹1.98 crores—driven entirely by a ₹2.00 crore tax reversal. The stock, trading at ₹92.14 as of May 29, 2026, has declined 20.98% over the past year and remains 37.72% below its 52-week high of ₹147.95, reflecting persistent investor concerns about business sustainability and operational viability.
Read full news article Announcements
Board Meeting Outcome for Approval Of Standalone Audited Financial Results For The Quarter And Financial Year Ended March 31 2026.
29-May-2026 | Source : BSEApproval of Standalone Audited Financial Results for the Quarter and Financial Year ended March 31 2026.
Results-Financial Results For The Quarter And Financial Year Ended March 31 2026
29-May-2026 | Source : BSEApproval of Standalone Audited Financial Results for the Quarter and Financial Year ended March 31 2026.
Compliances-Reg.24(A)-Annual Secretarial Compliance
29-May-2026 | Source : BSEAnnual Secretarial Compliance Report for the Financial Year ended March 31 2026.
Corporate Actions

No Upcoming Board Meetings

No Dividend history available

No Splits history available

No Bonus history available

No Rights history available
Quality key factors
Valuation key factors
Technicals key factors
 Technical Indicator Scale: Bearish, Mildly Bearish, Sideways, Mildly Bullish, Bullish Turned
 Shareholding Snapshot : Mar 2026
Shareholding Compare (%holding)
Promoters
None
Held by 0 Schemes
Held by 0 FIIs
Avantika Gupta (9.1%)
Chennai Material Recycling And Trading Co Pvt Ltd (8.57%)
20.11%
Quarterly Results Snapshot (Standalone) - Mar'26 - YoY

YoY Growth in quarter ended Mar 2026 is -89.79% vs 193.05% in Mar 2025

YoY Growth in quarter ended Mar 2026 is 942.11% vs -82.08% in Mar 2025
Half Yearly Results Snapshot (Standalone) - Sep'25
Growth in half year ended Sep 2025 is -11.18% vs 44.93% in Sep 2024
Growth in half year ended Sep 2025 is -19.56% vs -10.86% in Sep 2024
Nine Monthly Results Snapshot (Standalone) - Dec'25
YoY Growth in nine months ended Dec 2025 is -22.22% vs 38.97% in Dec 2024
YoY Growth in nine months ended Dec 2025 is -62.92% vs 1.32% in Dec 2024
Annual Results Snapshot (Standalone) - Mar'26
YoY Growth in year ended Mar 2026 is -40.52% vs 63.05% in Mar 2025
YoY Growth in year ended Mar 2026 is -15.71% vs 43.73% in Mar 2025
About Chennai Ferrous Industries Ltd

Company Coordinates


