
Compare GP Petroleums with Similar Stocks
Total Returns (Price + Dividend) 
Latest dividend: 0.75 per share ex-dividend date: Sep-21-2020
Risk Adjusted Returns v/s
Returns Beta

News
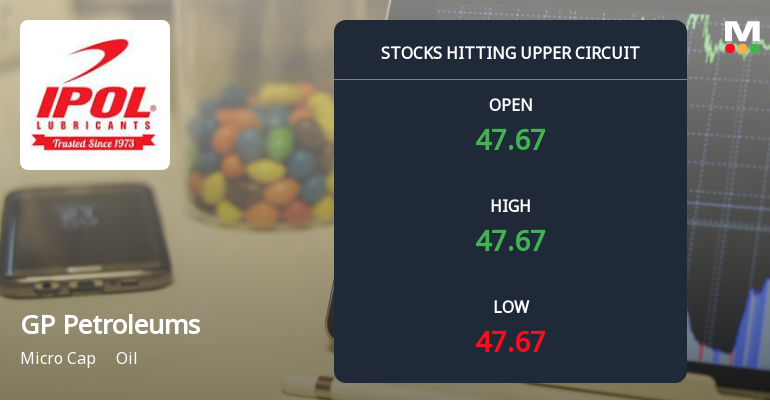
GP Petroleums Ltd Locks at Upper Circuit With 5.0% Gain — Buyers Queue, Sellers Absent
At Rs 47.71, the buying was done — not because demand dried up, but because the exchange wouldn't let the stock go any higher. GP Petroleums Ltd locked at its upper circuit of 5.0% on 28 Jul 2026, with buyers queuing and no sellers willing to part with shares.
Read full news article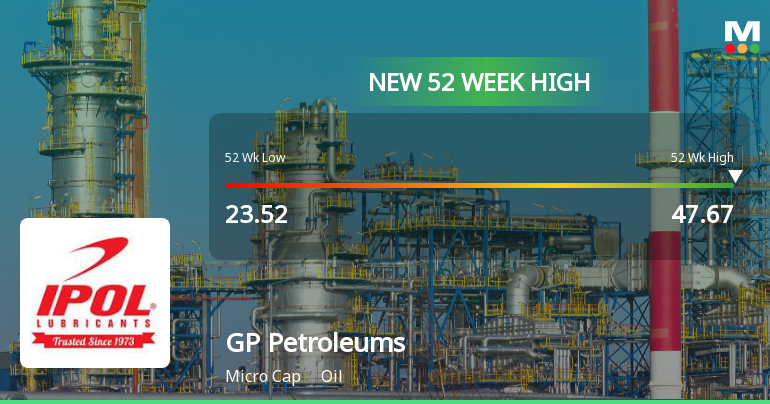
Broad-Based Technical Strength Lifts GP Petroleums Ltd to 52-Week High of Rs 47.67
With a sustained six-day rally culminating in a fresh 52-week high of Rs 47.67 on 28 Jul 2026, GP Petroleums Ltd has demonstrated remarkable price momentum, outpacing its sector and the broader market.
Read full news article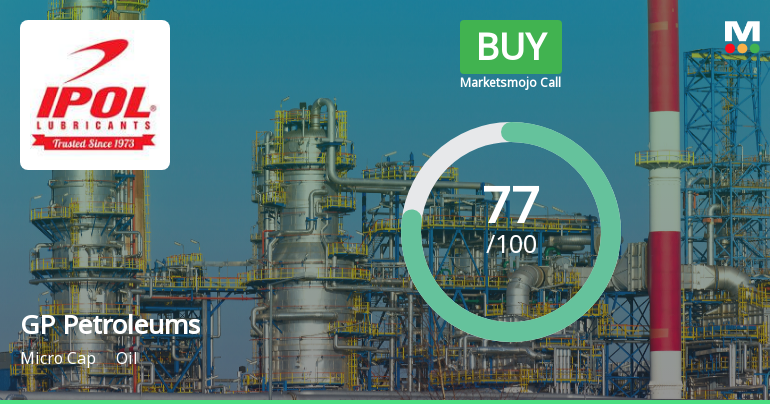
GP Petroleums Ltd Downgraded to Buy Amid Strong Financial and Technical Performance
GP Petroleums Ltd, a micro-cap player in the oil and lubricants sector, has seen its investment rating downgraded from Strong Buy to Buy as of 27 Jul 2026. This adjustment reflects a nuanced shift across four key parameters: quality, valuation, financial trend, and technicals. Despite robust quarterly financials and attractive valuation metrics, the downgrade signals a more cautious stance amid evolving market dynamics and technical indicators.
Read full news article Announcements
Announcement under Regulation 30 (LODR)-Newspaper Publication
25-Jul-2026 | Source : BSENewspaper publication of Unaudited (Standalone & Consolidated) Financial Results for the Quarter ended June 30 2026.
The Board Of Directors Has Fixed Wednesday August 19 2026 As The Record Date For The Purpose Of Determining The Entitlement Of Members To Receive The Final Dividend For The Financial Year Ended March 31 2026.
24-Jul-2026 | Source : BSEThe board has fixed Wednesday August 19 2026 as the record date for the purpose of determining the entitlement of members to receive the final dividend for the FY ended March 31 2026.
Announcement under Regulation 30 (LODR)-Press Release / Media Release
24-Jul-2026 | Source : BSEGP Petroleums delivers strong Q1 FY27 Results PAT Jumps 220% YoY to Rs. 20.6 Crore Revenue Rises 46% EBITDA Margin Expands 12.7% Board recommends Re. 0.50 Per Share Dividend for FY26.
Corporate Actions

No Upcoming Board Meetings

GP Petroleums Ltd has declared 10% dividend, ex-date: 19 Aug 26

No Splits history available

GP Petroleums Ltd has announced 23:19 bonus issue, ex-date: 09 Jul 13

No Rights history available
Quality key factors
Valuation key factors
Technicals key factors
 Technical Indicator Scale: Bearish, Mildly Bearish, Sideways, Mildly Bullish, Bullish Turned
 Shareholding Snapshot : Jun 2026
Shareholding Compare (%holding)
Non Institution
None
Held by 0 Schemes
Held by 2 FIIs (0.37%)
Gp Global Apac Pte Ltd (39.65%)
Incubit Energy (singapore) Pte Ltd (13.89%)
39.44%
Quarterly Results Snapshot (Standalone) - Jun'26 - QoQ

QoQ Growth in quarter ended Jun 2026 is 41.60% vs -3.92% in Mar 2026
QoQ Growth in quarter ended Jun 2026 is 127.12% vs 78.05% in Mar 2026
Half Yearly Results Snapshot (Standalone) - Sep'25
Growth in half year ended Sep 2025 is 6.65% vs -14.24% in Sep 2024
Growth in half year ended Sep 2025 is 7.88% vs -21.98% in Sep 2024
Nine Monthly Results Snapshot (Standalone) - Dec'25
YoY Growth in nine months ended Dec 2025 is 12.36% vs -13.64% in Dec 2024
YoY Growth in nine months ended Dec 2025 is -3.16% vs -14.11% in Dec 2024
Annual Results Snapshot (Standalone) - Mar'26
YoY Growth in year ended Mar 2026 is 5.37% vs -6.92% in Mar 2025
YoY Growth in year ended Mar 2026 is 0.57% vs -5.02% in Mar 2025
About GP Petroleums Ltd

Company Coordinates


