
Compare Viji Finance with Similar Stocks
Dashboard
Weak Long Term Fundamental Strength with an average Return on Equity (ROE) of 1.88%
With a growth in Net Sales of 298.31%, the company declared Very Positive results in Mar 26
With ROE of 12.7, it has a Fair valuation with a 3.2 Price to Book Value
Reducing Promoter Confidence
Market Beating performance in long term as well as near term
Stock DNA
Non Banking Financial Company (NBFC)
INR 71 Cr (Micro Cap)
3,399.00
21
0.00%
0.55
12.69%
3.24
Total Returns (Price + Dividend) 
Latest dividend: 0.007350999999999999 per share ex-dividend date: Sep-12-2018
Risk Adjusted Returns v/s
Returns Beta

News
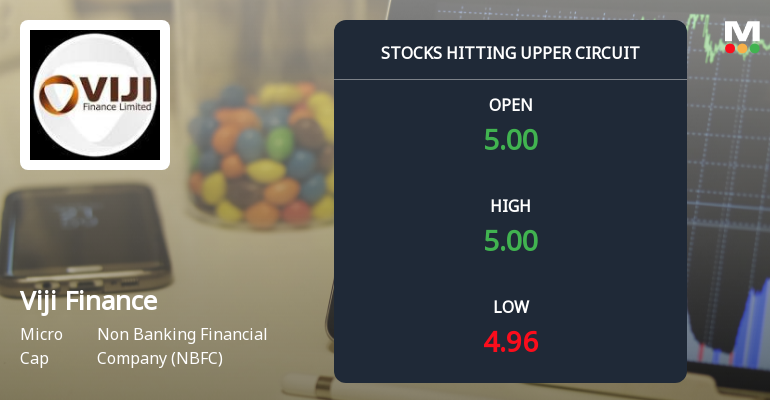
Viji Finance Ltd Locks at Upper Circuit With 4.86% Gain — Buyers Queue, Sellers Absent
At Rs 4.96, the buying was done — not because demand dried up, but because the exchange wouldn't let the stock go any higher. Viji Finance Ltd locked at its upper circuit of 4.86% on 23 Jun 2026, with buyers queuing and no sellers willing to part with shares.
Read full news article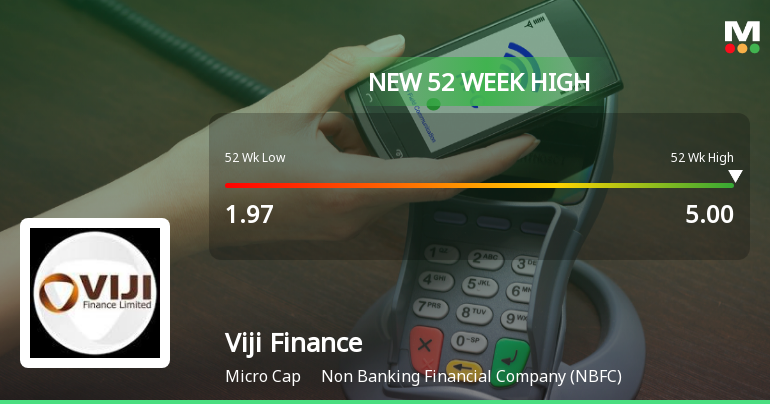
Broad-Based Technical Strength Lifts Viji Finance Ltd to 52-Week High of Rs 5
Surging past its previous peaks, Viji Finance Ltd reached a fresh 52-week high of Rs 5 on 23 Jun 2026, marking a remarkable rally of 112.77% over the past year. This milestone comes amid a sustained six-day winning streak, reflecting robust price momentum and a confluence of bullish technical indicators.
Read full news article
Viji Finance Ltd Locks at Upper Circuit With 4.88% Gain — Buyers Queue, Sellers Absent
At Rs 4.73, the buying was done — not because demand dried up, but because the exchange wouldn't let the stock go any higher. Viji Finance Ltd locked at its upper circuit of 4.88% on 22 Jun 2026, with buyers queuing and no sellers willing to part with shares.
Read full news article Announcements
Submission Of Certificate From Statutory Auditor In Terms Of Regulation 169(5) SEBI(ICDR Regulations)
20-Jun-2026 | Source : BSESubmission of Certificate from Statutory Auditor in terms of Regulation 169(5) SEBI (ICDR Regulations)
Board Meeting Outcome for Outcome Of Preferential Allotment Committee Meeting Held On Tuesday 16Th June 2026 Pursuant To Regulation 30 Of SEBI (Listing Obligations And Disclosure Requirements) Regulations 2015 Regarding Allotment Of 88500000 Convertibl
16-Jun-2026 | Source : BSEIn continuation of our intimation dated 24th March 2026 and 08th June 2026 regarding the proposed preferential issue of convertible warrants.
Announcement under Regulation 30 (LODR)-Allotment
16-Jun-2026 | Source : BSEContinuous disclosure as required under sub para 2.1 of para A of Part A of schedule III regarding allotment of warrant convertible into equivalent number of equity shares of the company.
Corporate Actions

No Upcoming Board Meetings

Viji Finance Ltd has declared 1% dividend, ex-date: 12 Sep 18

Viji Finance Ltd has announced 1:10 stock split, ex-date: 25 Oct 16

Viji Finance Ltd has announced 1:10 bonus issue, ex-date: 04 Aug 17

Viji Finance Ltd has announced 8:11 rights issue, ex-date: 15 May 24
Quality key factors
Valuation key factors
Technicals key factors
 Technical Indicator Scale: Bearish, Mildly Bearish, Sideways, Mildly Bullish, Bullish Turned
 Shareholding Snapshot : Mar 2026
Shareholding Compare (%holding)
Non Institution
None
Held by 0 Schemes
Held by 0 FIIs
Vijay Kothari (32.64%)
Laxmi Narayan Saha Huf (1.17%)
44.04%
Quarterly Results Snapshot (Standalone) - Mar'26 - YoY

YoY Growth in quarter ended Mar 2026 is 298.31% vs 7.27% in Mar 2025
YoY Growth in quarter ended Mar 2026 is 216.18% vs 0.00% in Mar 2025
Half Yearly Results Snapshot (Standalone) - Sep'25

Growth in half year ended Sep 2025 is 0.00% vs 32.56% in Sep 2024
Growth in half year ended Sep 2025 is -38.71% vs -358.33% in Sep 2024
Nine Monthly Results Snapshot (Standalone) - Dec'25
YoY Growth in nine months ended Dec 2025 is 57.80% vs 26.28% in Dec 2024
YoY Growth in nine months ended Dec 2025 is 224.39% vs -373.33% in Dec 2024
Annual Results Snapshot (Standalone) - Mar'26
YoY Growth in year ended Mar 2026 is 118.03% vs 20.73% in Mar 2025
YoY Growth in year ended Mar 2026 is 1,058.82% vs 41.67% in Mar 2025
About Viji Finance Ltd

Company Coordinates


