
Compare Viji Finance with Similar Stocks
Dashboard
Weak Long Term Fundamental Strength with an average Return on Equity (ROE) of 1.88%
The company has declared Positive results for the last 3 consecutive quarters
With ROE of 19.7, it has a Very Expensive valuation with a 8.5 Price to Book Value
Promoter holding has decreased this quarter and now hold 39.31% of the company
Consistent Returns over the last 3 years
Stock DNA
Non Banking Financial Company (NBFC)
INR 179 Cr (Micro Cap)
8,933.00
21
0.00%
0.55
19.70%
8.52
Total Returns (Price + Dividend) 
Latest dividend: 0.007350999999999999 per share ex-dividend date: Sep-12-2018
Risk Adjusted Returns v/s
Returns Beta

News
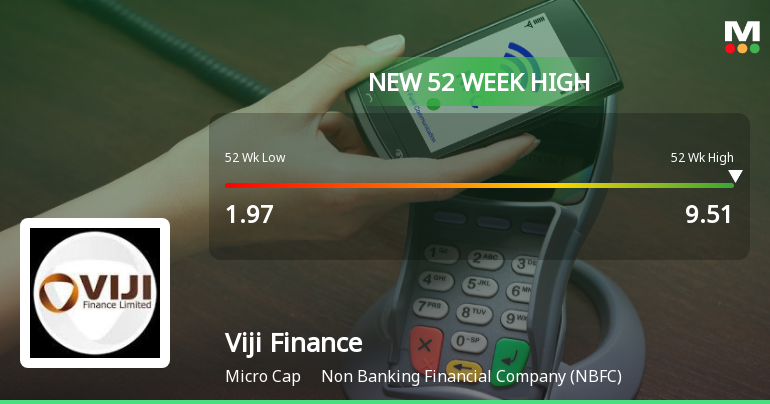
Broad-Based Technical Strength Lifts Viji Finance Ltd to 52-Week High of Rs 9.51
Surging past its previous peaks, Viji Finance Ltd reached a fresh 52-week high of Rs 9.51 on 27 Jul 2026, marking a remarkable rally of 143.85% over the past year against the Sensex’s decline of 6.00%. This milestone caps a sustained uptrend fuelled by a confluence of strong technical signals and persistent price momentum.
Read full news article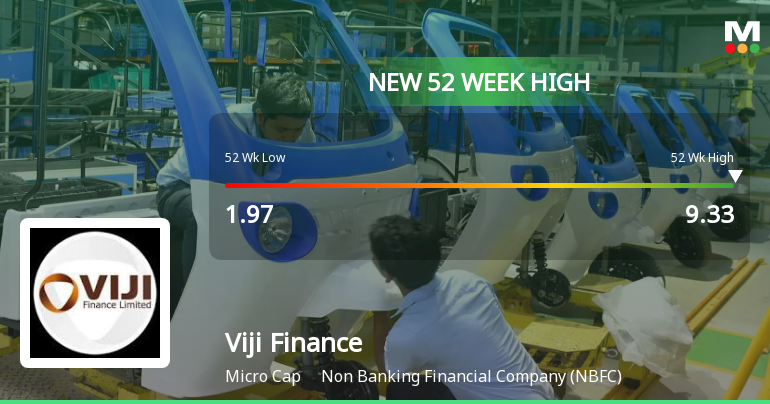
Broad-Based Technical Strength Lifts Viji Finance Ltd to 52-Week High of Rs 9.33
Surging to a new 52-week high of Rs 9.33 on 24 Jul 2026, Viji Finance Ltd has demonstrated remarkable price momentum, outperforming its sector by 3.7% today and extending a winning streak to 21 consecutive sessions with a 77.71% gain over this period.
Read full news article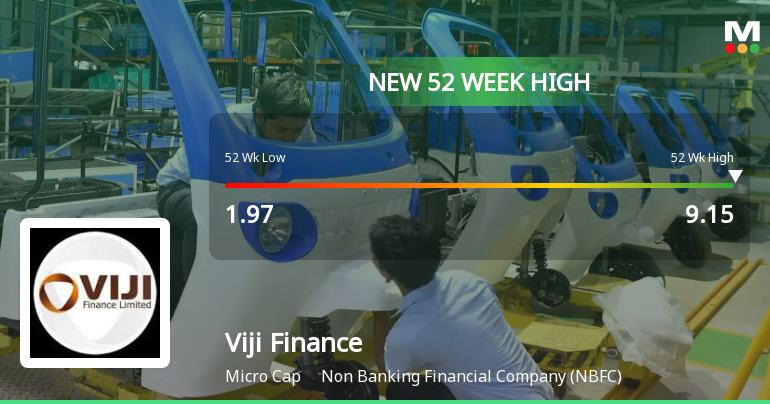
Broad-Based Technical Strength Lifts Viji Finance Ltd to 52-Week High of Rs 9.15
From a low of Rs 1.97 to a fresh peak of Rs 9.15, Viji Finance Ltd has more than quadrupled in value over the past year, marking an impressive 112.3% gain. This remarkable rally culminated in the stock hitting a new 52-week high on 23 Jul 2026, driven predominantly by a confluence of bullish technical indicators and sustained price momentum.
Read full news article Announcements
Board Meeting Outcome for Outcome Of Preferential Allotment Committee Meeting Held On Friday 24Th July 2026 Pursuant To Regulation 30 Of SEBI (Listing Obligations And Disclosure Requirements) Regulations 2015.
24-Jul-2026 | Source : BSEOutcome of Preferential Allotment Committee Meeting held on Friday 24th July 2026 pursuant to Regulation 30 of SEBI (Listing Obligations and Disclosure Requirements) Regulations 2015.
Announcement under Regulation 30 (LODR)-Allotment
24-Jul-2026 | Source : BSEDisclosure in connection with allotment of securities pursuant to Regulation 30 of SEBI LODR 2015.
Disclosures under Reg. 29(2) of SEBI (SAST) Regulations 2011
23-Jul-2026 | Source : BSEThe Exchange has received the disclosure under Regulation 29(2) of SEBI (Substantial Acquisition of Shares & Takeovers) Regulations 2011 for Ashik D Sanghvi HUF & PACs
Corporate Actions

No Upcoming Board Meetings

Viji Finance Ltd has declared 1% dividend, ex-date: 12 Sep 18

Viji Finance Ltd has announced 1:10 stock split, ex-date: 25 Oct 16

Viji Finance Ltd has announced 1:10 bonus issue, ex-date: 04 Aug 17

Viji Finance Ltd has announced 8:11 rights issue, ex-date: 15 May 24
Quality key factors
Valuation key factors
Technicals key factors
 Technical Indicator Scale: Bearish, Mildly Bearish, Sideways, Mildly Bullish, Bullish Turned
 Shareholding Snapshot : Jun 2026
Shareholding Compare (%holding)
Non Institution
None
Held by 0 Schemes
Held by 0 FIIs
Vijay Kothari (21.93%)
Vandana Ashokbhai Jain (2.08%)
53.71%
Quarterly Results Snapshot (Standalone) - Jun'26 - YoY

YoY Growth in quarter ended Jun 2026 is 56.14% vs 7.55% in Jun 2025
YoY Growth in quarter ended Jun 2026 is 445.45% vs -230.00% in Jun 2025
Half Yearly Results Snapshot (Standalone) - Sep'25

Growth in half year ended Sep 2025 is 0.00% vs 32.56% in Sep 2024
Growth in half year ended Sep 2025 is -38.71% vs -358.33% in Sep 2024
Nine Monthly Results Snapshot (Standalone) - Dec'25
YoY Growth in nine months ended Dec 2025 is 57.80% vs 26.28% in Dec 2024
YoY Growth in nine months ended Dec 2025 is 224.39% vs -373.33% in Dec 2024
Annual Results Snapshot (Standalone) - Mar'26
YoY Growth in year ended Mar 2026 is 118.03% vs 20.73% in Mar 2025
YoY Growth in year ended Mar 2026 is 1,058.82% vs 41.67% in Mar 2025
About Viji Finance Ltd

Company Coordinates


