
Compare Sh. Hari Chem. with Similar Stocks
Stock DNA
Commodity Chemicals
INR 68 Cr (Micro Cap)
17.00
13
0.00%
0.58
9.30%
1.57
Total Returns (Price + Dividend) 
Latest dividend: 1 per share ex-dividend date: Aug-24-2017
Risk Adjusted Returns v/s
Returns Beta

News
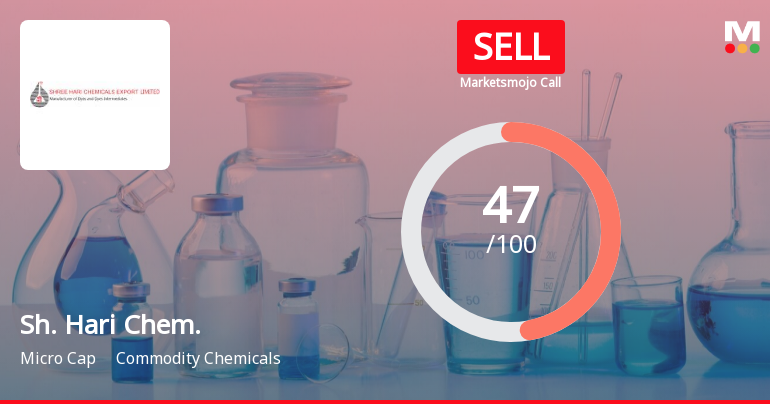
Shree Hari Chemicals Export Ltd is Rated Sell
Shree Hari Chemicals Export Ltd is rated 'Sell' by MarketsMOJO, with this rating last updated on 04 May 2026. However, the analysis and financial metrics discussed here reflect the stock's current position as of 29 June 2026, providing investors with the most recent and relevant data to assess the company’s outlook.
Read full news article
Shree Hari Chemicals Export Ltd is Rated Sell
Shree Hari Chemicals Export Ltd is rated Sell by MarketsMOJO, with this rating last updated on 04 May 2026. However, the analysis and financial metrics discussed here reflect the stock’s current position as of 17 June 2026, providing investors with the latest insights into its performance and outlook.
Read full news article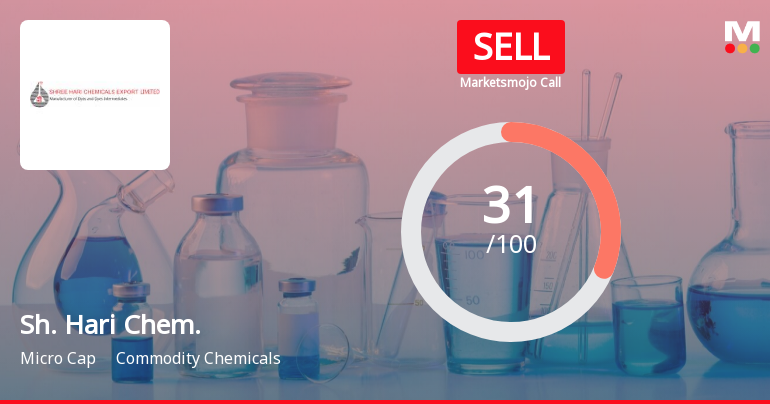
Shree Hari Chemicals Export Ltd is Rated Sell
Shree Hari Chemicals Export Ltd is rated 'Sell' by MarketsMOJO, with this rating last updated on 04 May 2026. However, the analysis and financial metrics discussed here reflect the stock's current position as of 28 May 2026, providing investors with an up-to-date view of the company’s fundamentals, returns, and technical outlook.
Read full news article Announcements
Closure of Trading Window
26-Jun-2026 | Source : BSEIntimation of closure of trading window w.e.f. July 01 2026 for the approval of Un-audited financial results for the quarter ended 30.06.2026
Announcement under Regulation 30 (LODR)-Newspaper Publication
25-Jun-2026 | Source : BSENewspaper Advertisement regarding the opening of special window for re-lodgement of transfer requests of physical shares
Compliances-Reg.24(A)-Annual Secretarial Compliance
21-May-2026 | Source : BSEAnnual Secretarial Compliance Report for the FY 2025-2026
Corporate Actions

No Upcoming Board Meetings

Shree Hari Chemicals Export Ltd has declared 10% dividend, ex-date: 24 Aug 17

No Splits history available

No Bonus history available

No Rights history available
Quality key factors
Valuation key factors
Technicals key factors
 Technical Indicator Scale: Bearish, Mildly Bearish, Sideways, Mildly Bullish, Bullish Turned
 Shareholding Snapshot : Mar 2026
Shareholding Compare (%holding)
Promoters
None
Held by 0 Schemes
Held by 0 FIIs
Shubhalakshmi Polyesters Limited (13.93%)
Din Bhandu Jalan (1.11%)
29.06%
Quarterly Results Snapshot (Consolidated) - Mar'26 - QoQ

QoQ Growth in quarter ended Mar 2026 is -7.35% vs -40.27% in Dec 2025
QoQ Growth in quarter ended Mar 2026 is -14.75% vs -65.44% in Dec 2025
Half Yearly Results Snapshot (Consolidated) - Sep'25
Growth in half year ended Sep 2025 is 47.13% vs -1.88% in Sep 2024

Growth in half year ended Sep 2025 is -24.49% vs 150.00% in Sep 2024
Nine Monthly Results Snapshot (Consolidated) - Dec'25
YoY Growth in nine months ended Dec 2025 is 34.96% vs 0.71% in Dec 2024
YoY Growth in nine months ended Dec 2025 is -39.57% vs 151.49% in Dec 2024
Annual Results Snapshot (Consolidated) - Mar'26
YoY Growth in year ended Mar 2026 is 30.67% vs 2.07% in Mar 2025
YoY Growth in year ended Mar 2026 is -19.22% vs 122.71% in Mar 2025
About Shree Hari Chemicals Export Ltd

Company Coordinates


