
Compare Sh. Hari Chem. with Similar Stocks
Dashboard
Healthy long term growth as Net Sales has grown by an annual rate of 26.86% and Operating profit at 37.64%
Flat results in Mar 26
With ROCE of 6.1, it has a Attractive valuation with a 1.6 Enterprise value to Capital Employed
Majority shareholders : Promoters
Consistent Returns over the last 3 years
Stock DNA
Commodity Chemicals
INR 86 Cr (Micro Cap)
21.00
46
0.00%
0.58
9.30%
1.97
Total Returns (Price + Dividend) 
Latest dividend: 1 per share ex-dividend date: Aug-24-2017
Risk Adjusted Returns v/s
Returns Beta

News
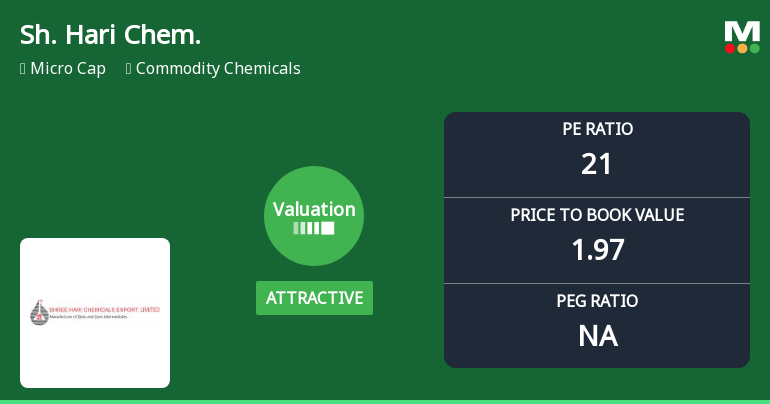
Shree Hari Chemicals Export Ltd Valuation Shifts Signal Renewed Price Attractiveness
Shree Hari Chemicals Export Ltd has witnessed a notable improvement in its valuation parameters, shifting from very attractive to attractive territory, signalling a positive change in price attractiveness despite a challenging commodity chemicals sector backdrop. This upgrade comes alongside a recent rating change from Sell to Hold, reflecting a more balanced outlook on the micro-cap stock’s prospects.
Read full news article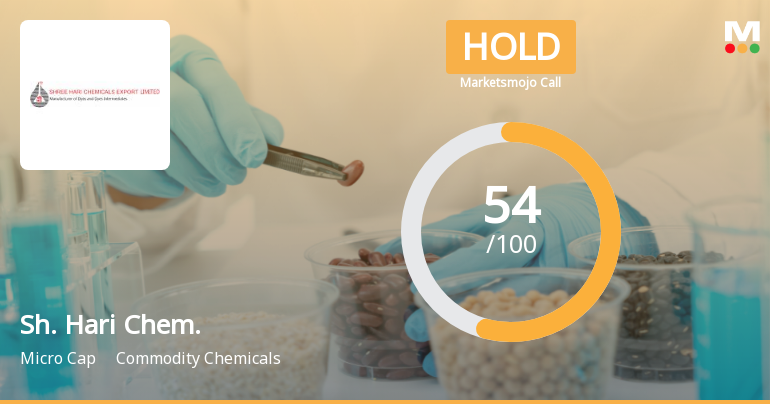
Shree Hari Chemicals Export Ltd Upgraded to Hold on Technical and Valuation Improvements
Shree Hari Chemicals Export Ltd has seen its investment rating upgraded from Sell to Hold, driven primarily by a marked improvement in technical indicators and a compelling valuation profile despite flat recent financial results. The micro-cap commodity chemicals firm’s Mojo Score has risen to 54.0, reflecting a more balanced outlook amid mixed fundamental signals and a bullish technical trend.
Read full news article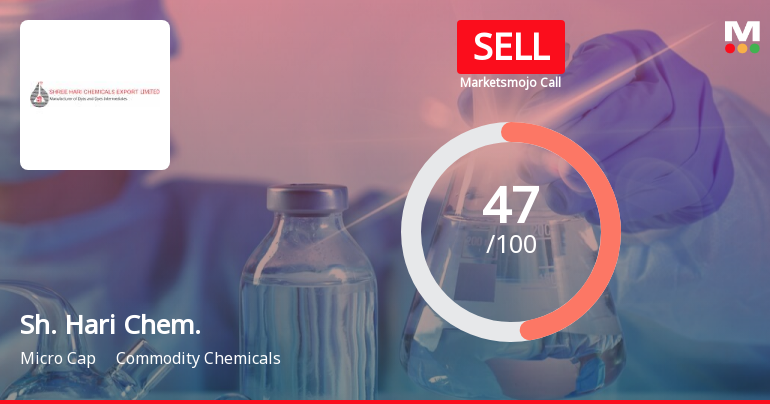
Shree Hari Chemicals Export Ltd is Rated Sell
Shree Hari Chemicals Export Ltd is rated 'Sell' by MarketsMOJO, with this rating last updated on 04 May 2026. However, the analysis and financial metrics discussed here reflect the stock's current position as of 10 July 2026, providing investors with an up-to-date view of the company’s fundamentals, returns, and technical outlook.
Read full news article Announcements
With Reference To Significant Movement In Price In Order To Ensure That Investors Have Latest Relevant Information About The Company And To Inform The Market So That The Interest Of The Investors Is Safeguarded Shree Hari Chemicals Export Ltd Has Submitte
17-Jul-2026 | Source : BSEWith reference to your E-mail Ref No. L/SURV/ONL/PV/SG/2026-2027/4070 dated July 16 2026 regarding clarification on Price Movement in the security of the Company We have to inform you that we do not have any such events information etc. that have a bearing on the operation/performance of the Company which include all price sensitive information.
Clarification sought from Shree Hari Chemicals Export Ltd
16-Jul-2026 | Source : BSEThe Exchange has sought clarification from Shree Hari Chemicals Export Ltd on July 16 2026 with reference to significant movement in price in order to ensure that investors have latest relevant information about the company and to inform the market so that the interest of the investors is safeguarded.
The reply is awaited.
Compliances-Certificate under Reg. 74 (5) of SEBI (DP) Regulations 2018
06-Jul-2026 | Source : BSECompliance Certificate under Regulation 74(5) of the SEBI DP Regulation 2018 for the quarter ended 30.06.2026.
Corporate Actions

No Upcoming Board Meetings

Shree Hari Chemicals Export Ltd has declared 10% dividend, ex-date: 24 Aug 17

No Splits history available

No Bonus history available

No Rights history available
Quality key factors
Valuation key factors
Technicals key factors
 Technical Indicator Scale: Bearish, Mildly Bearish, Sideways, Mildly Bullish, Bullish Turned
 Shareholding Snapshot : Mar 2026
Shareholding Compare (%holding)
Promoters
None
Held by 0 Schemes
Held by 0 FIIs
Shubhalakshmi Polyesters Limited (13.93%)
Din Bhandu Jalan (1.11%)
29.06%
Quarterly Results Snapshot (Consolidated) - Mar'26 - QoQ

QoQ Growth in quarter ended Mar 2026 is -7.35% vs -40.27% in Dec 2025
QoQ Growth in quarter ended Mar 2026 is -14.75% vs -65.44% in Dec 2025
Half Yearly Results Snapshot (Consolidated) - Sep'25
Growth in half year ended Sep 2025 is 47.13% vs -1.88% in Sep 2024

Growth in half year ended Sep 2025 is -24.49% vs 150.00% in Sep 2024
Nine Monthly Results Snapshot (Consolidated) - Dec'25
YoY Growth in nine months ended Dec 2025 is 34.96% vs 0.71% in Dec 2024
YoY Growth in nine months ended Dec 2025 is -39.57% vs 151.49% in Dec 2024
Annual Results Snapshot (Consolidated) - Mar'26
YoY Growth in year ended Mar 2026 is 30.67% vs 2.07% in Mar 2025
YoY Growth in year ended Mar 2026 is -19.22% vs 122.71% in Mar 2025
About Shree Hari Chemicals Export Ltd

Company Coordinates


