
Compare Shreyas Interm. with Similar Stocks
Dashboard
With a Operating Losses, the company has a Weak Long Term Fundamental Strength
- Poor long term growth as Operating profit has grown by an annual rate 2.68% of over the last 5 years
- Low ability to service debt as the company has a high Debt to EBITDA ratio of -7.74 times
Risky - Negative EBITDA
Consistent Underperformance against the benchmark over the last 3 years
Stock DNA
Commodity Chemicals
INR 43 Cr (Micro Cap)
NA (Loss Making)
20
0.00%
0.51
-8.27%
2.86
Total Returns (Price + Dividend) 
Shreyas Interm. for the last several years.
Risk Adjusted Returns v/s
Returns Beta

News

Shreyas Intermediates Ltd is Rated Strong Sell
Shreyas Intermediates Ltd is rated Strong Sell by MarketsMOJO, with this rating last updated on 09 Jan 2026. However, the analysis and financial metrics presented here reflect the company’s current position as of 18 June 2026, providing investors with the latest insights into its performance and outlook.
Read full news article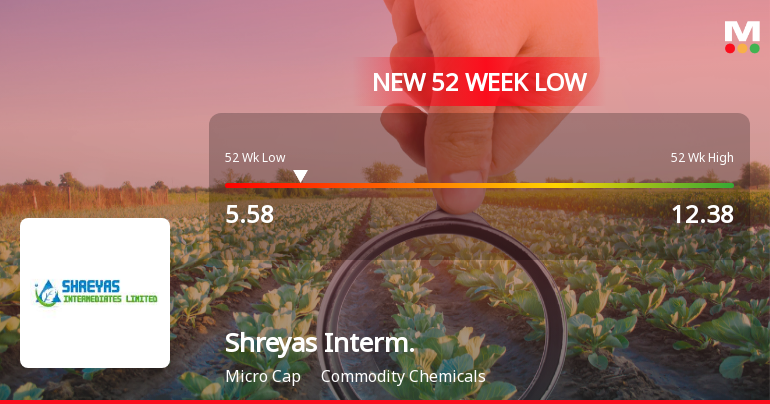
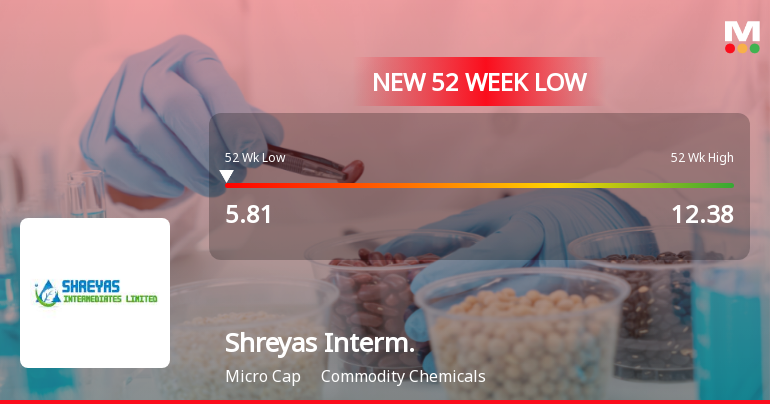
Five Consecutive Losses Push Shreyas Intermediates Ltd to a New 52-Week Low
For the fifth consecutive session, Shreyas Intermediates Ltd closed lower, slipping to a fresh 52-week low of Rs 5.81 on 8 Jun 2026. This marks a 15.67% decline over the past four days, underscoring sustained selling pressure despite a broader market that has shown signs of recovery.
Read full news article Announcements
Compliances-Reg.24(A)-Annual Secretarial Compliance
30-May-2026 | Source : BSEPursuent the Regulation 24(A) of the SEBI LODR Regulations2015 we enclosed herewith the Secretrial Compliance Report duly issued by Mr. Pankaj Desai PCS for the Financial Year ended March 31 2026.
Board Meeting Intimation for Intimation Of Board Meeting Under Regulation 29 Of The Securities And Exchange Board Of India (Listing Obligations .And Disclosure Requirements) Regulations 2015.
22-May-2026 | Source : BSEShreyas Intermediates Ltdhas informed BSE that the meeting of the Board of Directors of the Company is scheduled on 28/05/2026 inter alia to consider and approve In terms of Regulation 29 read with Regulation 30 and 33 of Securities & Exchange Board of India (Listing Obligations and Disclosures) Regulations 2015 this is to inform that the Meeting of the Board of Directors of M/s. Shreyas Intermediates Limited will be held on 28th May 2026 Thursday at the Corporate Office of the Company at 404 Naman Centre C-31 G-Block BKC Bandra East Mumbai 400051 at 04.00 p.m. to consider and approve the followings: 1. To consider and approve Audited Standalone Financial Results for the quarter and year ended 31st March 2026 along with Independent Audit Report thereon 2. Any other items with the permission of Chairman. Further as informed vide our letter dated March 30 2026 the Trading Window for dealing in the securities of the Company was closed from April 01 2026 and shall remain closed till 48 hours after the announcement of financial results by the Board of Directors at its meeting scheduled to be held on May 28 2026.
Format of the Annual Disclosure to be made by an entity identified as a LC - Annexure B2
30-Apr-2026 | Source : BSEFormat of the Annual Disclosure to be made by an entity identified as a Large Corporate.
| Sr. No. | Particulars | Details |
| 1 | Name of Company | Shreyas Intermediates Ltd |
| 2 | CIN NO. | L24120PN1989PLC145047 |
| 3 | Report filed for FY | 2025-2026 |
| Details of the Current block (all figures in Rs crore): | ||
| 4 | 2 - year block period (Specify financial years)* | 2025-26 & 2026-27 |
| 5 | Incremental borrowing done in FY (T)(a) | 0.00 |
| 6 | Mandatory borrowing to be done through debt securities in FY (T) (b) = (25% of a) | 0.00 |
| 7 | Actual borrowing done through debt securities in FY (T)(c) | 0.00 |
| 8 | Shortfall in the borrowing through debt securities if any for FY (T - 1) carried forward to FY (T) (d) | 0 |
| 8 | Quantum of (d) which has been met from (c)(e)* | 0 |
| 9 | Shortfall if any in the mandatory borrowing through debt securities for FY (T) { after adjusting for any shortfall in borrowing for FY(T - 1) which was carried forward to FY(T)}(f) = (b) - [(c) - (e)]{ If the calculated value is zero or negative write nil}* | 0 |
| Details of penalty to be paid if any in respect to previous block (all figures in Rs crore): | |
| 2 - year Block period (Specify financial years) | 2025-26 & 2026-27 |
| Amount of fine to be paid for the block if applicable Fine = 0.2% of {(d) - (e)}# | 0.00 |
| Name of the Company Secretary :- | BHAVESH VRUJLAL GONDALIYA |
| Designation :- | COMPANY SECRETARY AND COMPLIANCE OFFICER |
| Name of the Chief Financial Officer :- | RASHMI TANAJI KOTLE |
| Designation : - | CFO |
Date: 30/04/2026
Corporate Actions

No Upcoming Board Meetings

No Dividend history available

No Splits history available

No Bonus history available

No Rights history available
Quality key factors
Valuation key factors
Technicals key factors
 Technical Indicator Scale: Bearish, Mildly Bearish, Sideways, Mildly Bullish, Bullish Turned
 Shareholding Snapshot : Mar 2026
Shareholding Compare (%holding)
Promoters
10.028
Held by 3 Schemes (0.0%)
Held by 1 FIIs (8.39%)
Kesar Petroproducts Limited (27.59%)
Krish Pharma Speciality Private Limited- Escrow Demat Accoun (24.7%)
7.83%
Quarterly Results Snapshot (Standalone) - Mar'26 - QoQ

QoQ Growth in quarter ended Mar 2026 is 0.00% vs -100.00% in Dec 2025
QoQ Growth in quarter ended Mar 2026 is 28.21% vs -62.50% in Dec 2025
Half Yearly Results Snapshot (Standalone) - Sep'25
Growth in half year ended Sep 2025 is 0.00% vs 0.00% in Sep 2024
Growth in half year ended Sep 2025 is 36.26% vs -8.33% in Sep 2024
Nine Monthly Results Snapshot (Standalone) - Dec'25
YoY Growth in nine months ended Dec 2025 is 0.00% vs 0.00% in Dec 2024
YoY Growth in nine months ended Dec 2025 is 23.62% vs 11.81% in Dec 2024
Annual Results Snapshot (Standalone) - Mar'26
YoY Growth in year ended Mar 2026 is 0.00% vs 0.00% in Mar 2025
YoY Growth in year ended Mar 2026 is 20.75% vs -0.63% in Mar 2025
About Shreyas Intermediates Ltd

Company Coordinates


