
Compare Himatsing. Seide with Similar Stocks
Dashboard
Weak Long Term Fundamental Strength with an average Return on Capital Employed (ROCE) of 6.76%
- Poor long term growth as Net Sales has grown by an annual rate of 2.18% and Operating profit at 7.97% over the last 5 years
- Low ability to service debt as the company has a high Debt to EBITDA ratio of 7.23 times
With a fall in Operating Profit of -64.18%, the company declared Very Negative results in Mar 26
Falling Participation by Institutional Investors
Stock DNA
Garments & Apparels
INR 1,003 Cr (Micro Cap)
16.00
25
0.24%
1.19
2.89%
0.48
Total Returns (Price + Dividend) 
Latest dividend: 0.2506641366223909 per share ex-dividend date: Sep-19-2025
Risk Adjusted Returns v/s
Returns Beta

News
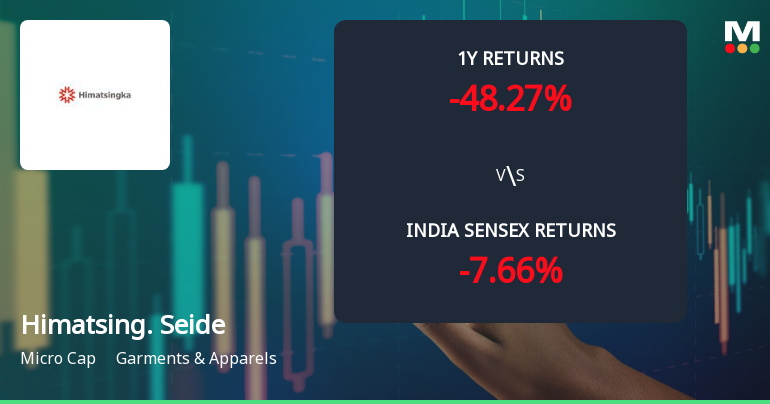
Himatsingka Seide Ltd Faces Intensified Downtrend Amid Technical Deterioration
Himatsingka Seide Ltd, a micro-cap player in the Garments & Apparels sector, has experienced a notable shift in its technical momentum, signalling increased bearishness. The stock’s recent price action and technical indicators reveal a deteriorating trend, with key metrics such as MACD, moving averages, and Bollinger Bands pointing towards sustained downside pressure amid weak relative performance versus the Sensex.
Read full news article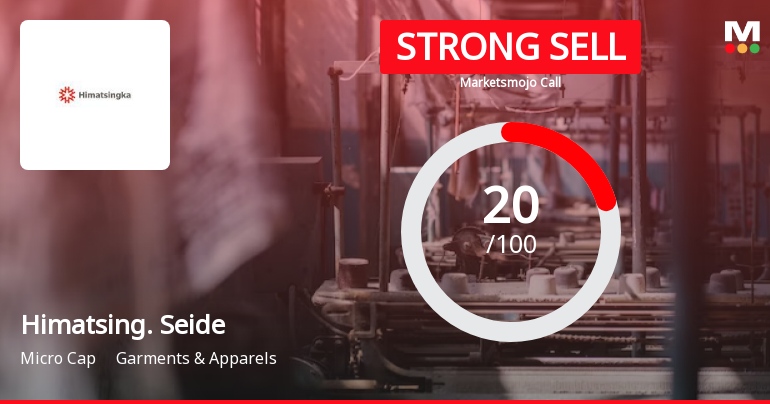
Himatsingka Seide Ltd is Rated Strong Sell
Himatsingka Seide Ltd is rated Strong Sell by MarketsMOJO, with this rating last updated on 11 February 2026. However, the analysis and financial metrics presented here reflect the company’s current position as of 19 July 2026, providing investors with the latest insights into its performance and outlook.
Read full news article
Himatsingka Seide Ltd is Rated Strong Sell
Himatsingka Seide Ltd is rated Strong Sell by MarketsMOJO, with this rating last updated on 11 February 2026. However, the analysis and financial metrics presented here reflect the company’s current position as of 08 July 2026, providing investors with an up-to-date view of the stock’s fundamentals, valuation, financial trends, and technical outlook.
Read full news article Announcements
Announcement under Regulation 30 (LODR)-Allotment
13-Jul-2026 | Source : BSEWe hereby inform you that the Securities Committee of the Board has on July 13 2026 allotted 300 Tranche 1 Series E Debentures each having face value of Rs. 5 Lakhs only issued at par aggregating to Rs. 15 crores on a private placement basis.
Compliances-Certificate under Reg. 74 (5) of SEBI (DP) Regulations 2018
10-Jul-2026 | Source : BSEPlease find enclosed the certificate received from KFin Technologies Limited for the quarter ended June 30 2026.
Announcement under Regulation 30 (LODR)-Credit Rating
10-Jul-2026 | Source : BSECRISIL Ratings Limited has vide communication dated July 10 2026 reaffirmed the credit rating of the Company.
Corporate Actions

No Upcoming Board Meetings

Himatsingka Seide Ltd has declared 5% dividend, ex-date: 19 Sep 25

No Splits history available

No Bonus history available

No Rights history available
Quality key factors
Valuation key factors
Technicals key factors
 Technical Indicator Scale: Bearish, Mildly Bearish, Sideways, Mildly Bullish, Bullish Turned
 Shareholding Snapshot : Jun 2026
Shareholding Compare (%holding)
Non Institution
None
Held by 3 Schemes (0.0%)
Held by 39 FIIs (7.44%)
Dinesh Kumar Himatsingka (9.47%)
Jupiter India Fund (3.97%)
43.2%
Quarterly Results Snapshot (Consolidated) - Mar'26 - YoY

YoY Growth in quarter ended Mar 2026 is -6.04% vs -5.73% in Mar 2025
YoY Growth in quarter ended Mar 2026 is -88.19% vs -49.71% in Mar 2025
Half Yearly Results Snapshot (Consolidated) - Sep'25
Growth in half year ended Sep 2025 is -10.02% vs 0.60% in Sep 2024

Growth in half year ended Sep 2025 is 25.15% vs -27.05% in Sep 2024
Nine Monthly Results Snapshot (Consolidated) - Dec'25
YoY Growth in nine months ended Dec 2025 is -10.53% vs -1.09% in Dec 2024
YoY Growth in nine months ended Dec 2025 is -5.54% vs -28.05% in Dec 2024
Annual Results Snapshot (Consolidated) - Mar'26
YoY Growth in year ended Mar 2026 is -9.47% vs -2.23% in Mar 2025
YoY Growth in year ended Mar 2026 is -18.52% vs -32.60% in Mar 2025
About Himatsingka Seide Ltd

Company Coordinates


