
Compare Himatsing. Seide with Similar Stocks
Dashboard
Weak Long Term Fundamental Strength with an average Return on Capital Employed (ROCE) of 6.76%
- Poor long term growth as Net Sales has grown by an annual rate of 2.18% and Operating profit at 7.97% over the last 5 years
- Low ability to service debt as the company has a high Debt to EBITDA ratio of 7.23 times
With a fall in Operating Profit of -64.18%, the company declared Very Negative results in Mar 26
Falling Participation by Institutional Investors
Stock DNA
Garments & Apparels
INR 1,137 Cr (Micro Cap)
18.00
26
0.22%
1.19
2.89%
0.52
Total Returns (Price + Dividend) 
Latest dividend: 0.2506641366223909 per share ex-dividend date: Sep-19-2025
Risk Adjusted Returns v/s
Returns Beta

News

Himatsingka Seide Ltd is Rated Strong Sell
Himatsingka Seide Ltd is rated Strong Sell by MarketsMOJO, with this rating last updated on 11 February 2026. However, the analysis and financial metrics discussed here reflect the stock’s current position as of 16 June 2026, providing investors with an up-to-date view of the company’s fundamentals, returns, and market standing.
Read full news article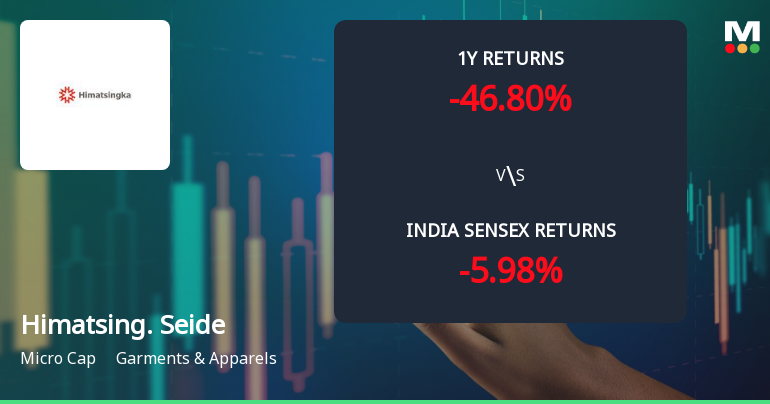
Himatsingka Seide Ltd Technical Momentum Shifts Amid Prolonged Downtrend
Himatsingka Seide Ltd, a micro-cap player in the Garments & Apparels sector, has experienced a subtle shift in its technical momentum, moving from a bearish stance to a mildly bearish outlook. Despite a modest day gain of 2.08%, the stock’s broader technical indicators reveal a complex picture of mixed signals, underscoring the challenges faced by investors amid persistent downward pressure and volatile market conditions.
Read full news article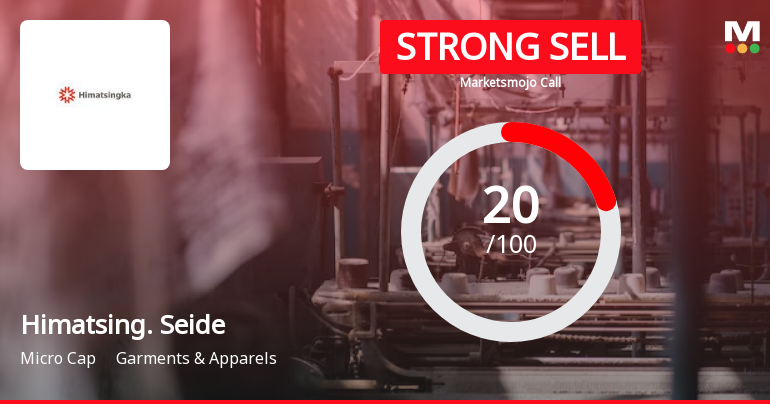
Himatsingka Seide Ltd is Rated Strong Sell
Himatsingka Seide Ltd is rated Strong Sell by MarketsMOJO, with this rating last updated on 11 February 2026. However, the analysis and financial metrics discussed here reflect the stock’s current position as of 08 June 2026, providing investors with the latest insights into the company’s performance and outlook.
Read full news article Announcements
Announcement under Regulation 30 (LODR)-Newspaper Publication
19-Jun-2026 | Source : BSEPlease find enclosed the copy of newspaper publication.
Announcement under Regulation 30 (LODR)-Earnings Call Transcript
02-Jun-2026 | Source : BSEWe enclose herewith transcript of the earnings call held on May 29 2026.
Shareholder Meeting / Postal Ballot-Scrutinizers Report
01-Jun-2026 | Source : BSEPlease find enclosed Voting results of Postal Ballot along with Scrutinizers Report.
Corporate Actions

No Upcoming Board Meetings

Himatsingka Seide Ltd has declared 5% dividend, ex-date: 19 Sep 25

No Splits history available

No Bonus history available

No Rights history available
Quality key factors
Valuation key factors
Technicals key factors
 Technical Indicator Scale: Bearish, Mildly Bearish, Sideways, Mildly Bullish, Bullish Turned
 Shareholding Snapshot : Mar 2026
Shareholding Compare (%holding)
Non Institution
None
Held by 4 Schemes (0.0%)
Held by 46 FIIs (11.1%)
Dinesh Kumar Himatsingka (9.47%)
Jupiter India Fund (4.19%)
36.87%
Quarterly Results Snapshot (Consolidated) - Mar'26 - YoY

YoY Growth in quarter ended Mar 2026 is -6.04% vs -5.73% in Mar 2025
YoY Growth in quarter ended Mar 2026 is -88.19% vs -49.71% in Mar 2025
Half Yearly Results Snapshot (Consolidated) - Sep'25
Growth in half year ended Sep 2025 is -10.02% vs 0.60% in Sep 2024

Growth in half year ended Sep 2025 is 25.15% vs -27.05% in Sep 2024
Nine Monthly Results Snapshot (Consolidated) - Dec'25
YoY Growth in nine months ended Dec 2025 is -10.53% vs -1.09% in Dec 2024
YoY Growth in nine months ended Dec 2025 is -5.54% vs -28.05% in Dec 2024
Annual Results Snapshot (Consolidated) - Mar'26
YoY Growth in year ended Mar 2026 is -9.47% vs -2.23% in Mar 2025
YoY Growth in year ended Mar 2026 is -18.52% vs -32.60% in Mar 2025
About Himatsingka Seide Ltd

Company Coordinates


