
Compare Centrum Capital with Similar Stocks
Stock DNA
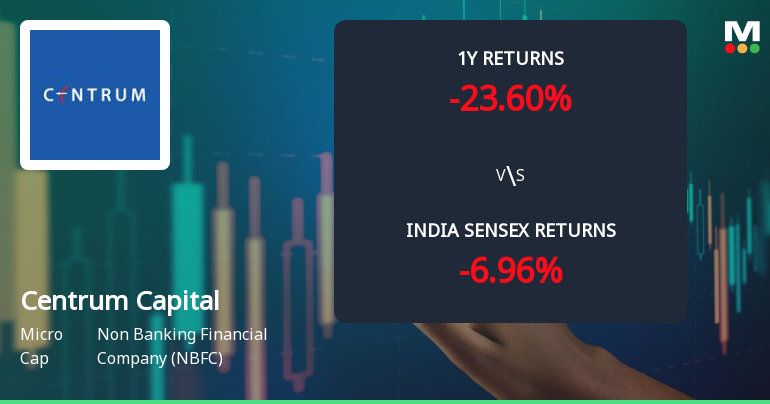
Non Banking Financial Company (NBFC)
INR 1,120 Cr (Micro Cap)
NA (Loss Making)
21
0.00%
51.52
-108.87%
3.61
Total Returns (Price + Dividend) 
Latest dividend: 0.05 per share ex-dividend date: Sep-04-2019
Risk Adjusted Returns v/s
Returns Beta

News
Centrum Capital Ltd Faces Intensified Bearish Momentum Amid Technical Downgrade
Centrum Capital Ltd, a micro-cap player in the Non Banking Financial Company (NBFC) sector, has experienced a marked shift in its technical momentum, prompting a downgrade in its Mojo Grade to Strong Sell. The stock’s price momentum and key technical indicators reveal a deteriorating outlook, with bearish signals dominating across weekly and monthly charts as the company’s shares trade near their 52-week lows.
Read full news article
Centrum Capital Ltd Technical Momentum Shifts Amid Mixed Market Signals
Centrum Capital Ltd, a micro-cap player in the Non Banking Financial Company (NBFC) sector, has experienced a notable shift in its technical momentum, reflected in a strong day gain of 11.40% to close at ₹24.24 on 23 June 2026. Despite this surge, the company’s overall technical indicators present a complex picture, with several bearish signals persisting alongside emerging mildly bullish trends, prompting a reassessment of its near-term outlook.
Read full news article
Centrum Capital Ltd is Rated Strong Sell
Centrum Capital Ltd is rated Strong Sell by MarketsMOJO. This rating was last updated on 24 Nov 2025, reflecting a reassessment of the stock’s outlook. However, the analysis and financial metrics presented here are based on the company’s current position as of 21 June 2026, providing investors with the latest insights into its performance and valuation.
Read full news article Announcements
Disclosures under Reg. 31(1) and 31(2) of SEBI (SAST) Regulations 2011.
13-Jun-2026 | Source : BSEThe Exchange has received Disclosure under Regulation 31(1) and 31(2) of SEBI (Substantial Acquisition of Shares & Takeovers) Regulations 2011 on June 12 2026 for Business Match Services (India) Pvt Ltd
Announcement under Regulation 30 (LODR)-Allotment of ESOP / ESPS
03-Jun-2026 | Source : BSEPlease find attached disclosure under Regulation 30 of SEBI (Listing Obligation and Disclosure Requirements) Regulations 2015
Announcement under Regulation 30 (LODR)-Newspaper Publication
03-Jun-2026 | Source : BSEPlease find enclosed Newspaper Publication-Special Window for re-lodgement of transfer requests of physical shares.
Corporate Actions

No Upcoming Board Meetings

Centrum Capital Ltd has declared 5% dividend, ex-date: 04 Sep 19

Centrum Capital Ltd has announced 1:10 stock split, ex-date: 03 Jul 13

Centrum Capital Ltd has announced 5:1 bonus issue, ex-date: 03 Jul 13

No Rights history available
Quality key factors
Valuation key factors
Technicals key factors
 Technical Indicator Scale: Bearish, Mildly Bearish, Sideways, Mildly Bullish, Bullish Turned
 Shareholding Snapshot : Mar 2026
Shareholding Compare (%holding)
Non Institution
29.9622
Held by 0 Schemes
Held by 7 FIIs (1.22%)
Businessmatch Services (india) Private Limited (27.63%)
Kaikobad Byramjee & Son Agency Private Limited (11.1%)
25.72%
Quarterly Results Snapshot (Consolidated) - Mar'26 - QoQ

QoQ Growth in quarter ended Mar 2026 is 17.23% vs 6.73% in Dec 2025
QoQ Growth in quarter ended Mar 2026 is 113.97% vs -139.21% in Dec 2025
Half Yearly Results Snapshot (Consolidated) - Sep'25

Growth in half year ended Sep 2025 is 11.30% vs 53.56% in Sep 2024
Growth in half year ended Sep 2025 is 52.41% vs -57.38% in Sep 2024
Nine Monthly Results Snapshot (Consolidated) - Dec'25
YoY Growth in nine months ended Dec 2025 is 7.17% vs 54.67% in Dec 2024
YoY Growth in nine months ended Dec 2025 is 9.08% vs -65.39% in Dec 2024
Annual Results Snapshot (Consolidated) - Mar'26
YoY Growth in year ended Mar 2026 is 7.72% vs 58.30% in Mar 2025
YoY Growth in year ended Mar 2026 is 26.26% vs -88.71% in Mar 2025
About Centrum Capital Ltd

Company Coordinates


