
Compare Finkurve Fin. with Similar Stocks
Stock DNA
Non Banking Financial Company (NBFC)
INR 873 Cr (Micro Cap)
34.00
21
0.00%
1.16
7.92%
2.73
Total Returns (Price + Dividend) 
Finkurve Fin. for the last several years.
Risk Adjusted Returns v/s
Returns Beta

News
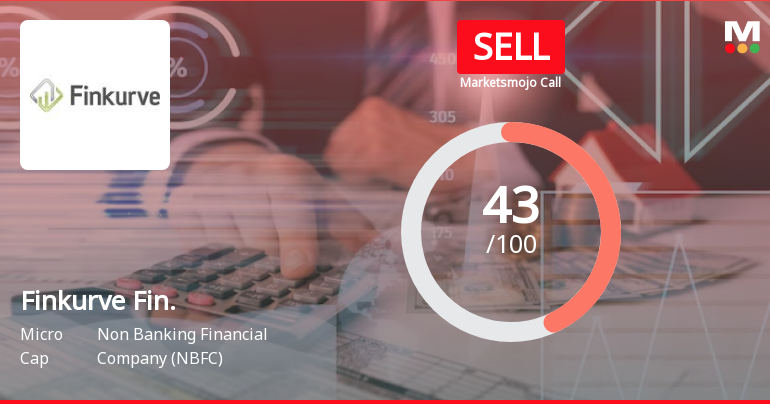
Finkurve Financial Services Ltd is Rated Sell
Finkurve Financial Services Ltd is rated 'Sell' by MarketsMOJO, with this rating last updated on 20 May 2026. However, the analysis and financial metrics discussed here reflect the stock's current position as of 13 July 2026, providing investors with the latest insights into its performance and outlook.
Read full news article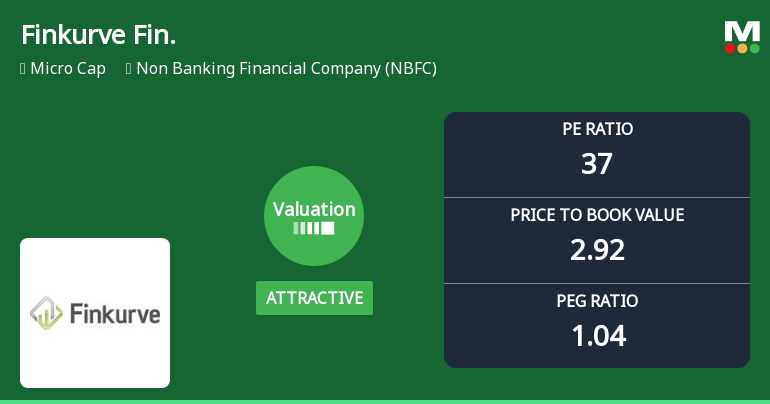
Finkurve Financial Services Ltd: Valuation Shifts Signal Renewed Price Attractiveness
Finkurve Financial Services Ltd has witnessed a notable shift in its valuation parameters, moving from a very attractive to an attractive rating, reflecting a nuanced change in price attractiveness despite ongoing sector headwinds. With a current P/E ratio of 36.83 and a P/BV of 2.92, the micro-cap NBFC is showing signs of valuation recalibration relative to its historical averages and peer group, offering investors a fresh perspective on its market positioning.
Read full news article
Finkurve Financial Services Ltd is Rated Sell
Finkurve Financial Services Ltd is rated Sell by MarketsMOJO, with this rating last updated on 20 May 2026. While the rating was revised on that date, the analysis and financial metrics presented here reflect the stock’s current position as of 02 July 2026, providing investors with an up-to-date view of the company’s fundamentals, valuation, financial trend, and technical outlook.
Read full news article Announcements
Corporate Actions

No Upcoming Board Meetings

No Dividend history available

Finkurve Financial Services Ltd has announced 1:10 stock split, ex-date: 26 Feb 14

Finkurve Financial Services Ltd has announced 6:1 bonus issue, ex-date: 22 Aug 13

No Rights history available
Quality key factors
Valuation key factors
Technicals key factors
 Technical Indicator Scale: Bearish, Mildly Bearish, Sideways, Mildly Bullish, Bullish Turned
 Shareholding Snapshot : Jun 2026
Shareholding Compare (%holding)
Promoters
None
Held by 0 Schemes
Held by 7 FIIs (7.3%)
Mohinidevi Bhanwarlal Kothari (28.92%)
Thomas John Muthoot (13.15%)
30.32%
Quarterly Results Snapshot (Standalone) - Mar'26 - QoQ

QoQ Growth in quarter ended Mar 2026 is 29.58% vs 8.14% in Dec 2025

QoQ Growth in quarter ended Mar 2026 is 15.19% vs 17.91% in Dec 2025
Half Yearly Results Snapshot (Standalone) - Sep'25
Growth in half year ended Sep 2025 is 45.75% vs 40.14% in Sep 2024
Growth in half year ended Sep 2025 is 40.08% vs 25.56% in Sep 2024
Nine Monthly Results Snapshot (Standalone) - Dec'25
YoY Growth in nine months ended Dec 2025 is 39.61% vs 50.25% in Dec 2024
YoY Growth in nine months ended Dec 2025 is 33.26% vs 20.86% in Dec 2024
Annual Results Snapshot (Standalone) - Mar'26
YoY Growth in year ended Mar 2026 is 47.51% vs 56.02% in Mar 2025
YoY Growth in year ended Mar 2026 is 49.51% vs 8.34% in Mar 2025
About Finkurve Financial Services Ltd

Company Coordinates


