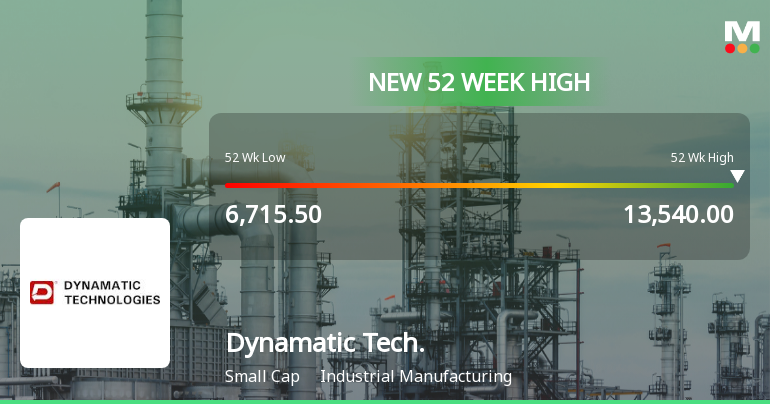
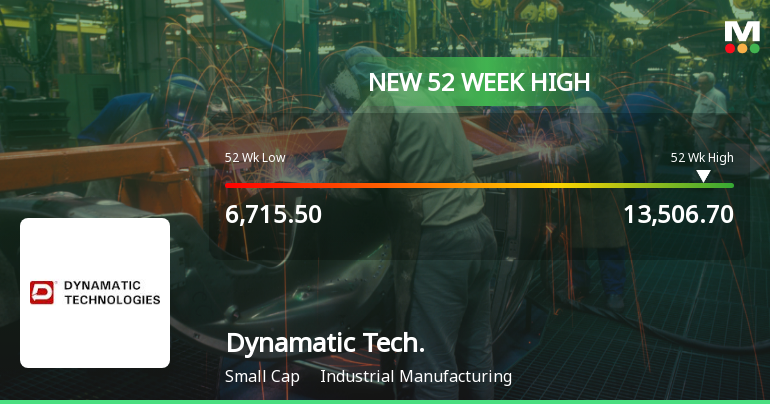
Dynamatic Tech.

  • Market Cap: Small Cap
  • Industry: Industrial Manufacturing
  • ISIN: INE221B01012
  • NSEID: DYNAMATECH
  • BSEID: 505242
INR
11,224.00
394.55 (3.64%)
BSENSE

Aug 14, 04:01 PM

BSE+NSE Vol: 26.25 k

  • Price Points
  • Score
  • Mojo Parameters
  • Total Return
  • News and Corporate Actions
  • Key factors
  • Shareholding
  • Financials
  • CompanyCV
stock-summaryPrice Point
High/Low

1Day

52 Week

Valuation
Technical
Day's Volume

CASH

26.25 k (-30.31%) Volume

Shareholding (Jun 2026)

FII

10.26%

Held by 51 FIIs

DII

15.85%

Held by 8 DIIs

Promoter

41.50%

Why is Dynamatic Technologies Ltd falling/rising?

16-Aug-2026

As of 15-Aug, Dynamatic Technologies Ltd's stock price is rising, currently at 11,224.00 with a 3.64% increase. The stock has shown strong performance with a 73.80% return over the past year, driven by significant profit growth and high institutional confidence, despite concerns about long-term fundamentals.

As of 15-Aug, Dynamatic Technologies Ltd's stock price is rising, as indicated by a current price of 11,224.00, reflecting a change of 394.55 (3.64%) upward. The stock has outperformed its sector by 3.74% today and has experienced consecutive gains over the last three days, accumulating a total return of 6.18% during this period. Additionally, the stock reached an intraday high of Rs 11,294, marking a 4.29% increase.<BR><BR>The positive momentum can be attributed to several factors. The company reported a significant growth in net profit of 65.53% and has declared positive results for the last three consecutive quarters. Furthermore, net sales for the first nine months have grown by 20.23%, and the operating profit to interest ratio is at its highest level of 3.69 times. High institutional holdings at 26.11% suggest confidence from investors who typically have better resources to analyze company fundamentals.<BR><BR>In terms of performance relative to the market, Dynamatic Technologies Ltd has generated a remarkable return of 73.80% over the past year, significantly outperforming the broader market, which has seen returns of only 3.82%. This strong performance, combined with positive financial results, has contributed to the stock's rising price. However, it is important to note that there are concerns regarding long-term fundamental strength, as indicated by a relatively low return on capital employed and high debt levels, but these factors have not yet impacted the stock's current upward trajectory.

View full answer

Who are in the management team of Dynamatic Tech.?

14-Aug-2026

The management team of Dynamatic Tech includes Govind Mirchandani (Chairman), Udayant Malhoutra (CEO), and several independent and non-executive directors, bringing diverse expertise to the company.

The management team of Dynamatic Tech includes the following individuals:<BR><BR>1. **Govind Mirchandani** - Chairman & Independent Director<BR>2. **Malavika Jayaram** - Independent Non-Executive Director<BR>3. **Pradyumna Rameshchandra Vyas** - Independent Non-Executive Director<BR>4. **Pierre de Bausset** - Independent Non-Executive Director<BR>5. **Dietmar Hahn** - Non-Executive & Non-Independent Director<BR>6. **James Tucker** - Non-Executive & Non-Independent Director<BR>7. **P S Ramesh** - Executive Director<BR>8. **Udayant Malhoutra** - Executive Director, Managing Director, CEO, and Promoter<BR><BR>This team brings a diverse range of expertise and leadership to the company.

View full answer

What does Dynamatic Tech. do?

14-Aug-2026

Dynamatic Technologies Ltd is a manufacturer of specialized products for the Aerospace, Automotive, and Hydraulic industries, classified as a Small Cap company with a market cap of INR 7,468 Cr. As of June 2026, it reported net sales of 425 Cr and a net profit of 21 Cr.

Overview:<BR>Dynamatic Technologies Ltd is a manufacturer of highly engineered, mission-critical products for the Aerospace, Automotive, and Hydraulic industries, operating within the Industrial Manufacturing sector and classified as a Small Cap company.<BR><BR>History:<BR>Dynamatic Technologies Ltd was incorporated in 1973 under the name 'Dynamatic Hydraulics Limited' and changed its name in 1992. The latest quarterly results reported net sales and net profit for June 2026.<BR><BR>Financial Snapshot:<BR>- Net Sales: 425 Cr (Quarterly Results - Jun 2026)<BR>- Net Profit: 21 Cr (Quarterly Results - Jun 2026)<BR>- Market Cap: INR 7,468 Cr (Small Cap)<BR><BR>Key Metrics:<BR>- P/E: 123.00<BR>- Industry P/E: 45<BR>- Dividend Yield: 0.04%<BR>- Debt-Equity: 0.72<BR>- Return on Equity: 6.30%<BR>- Price to Book: 9.14<BR><BR>Contact Details:<BR>Address: Dynamatic Park, Peenya Bangalore Karnataka : 560058<BR>Tel: 91-80-28394933/34/35<BR>Email: investor.relations@dynamatics.net<BR>Website: http://www.dynamatics.com

View full answer

Who are the peers of the Dynamatic Tech.?

14-Aug-2026

Dynamatic Tech.'s peers include Tega Inds., Titagarh Rail, Jupiter Wagons, Elecon Engg.Co, Kennametal India, Standard Enginee, Praj Industries, Centum Electron, and Cyient DLM. While Tega Inds. and Kennametal India show excellent management and growth, Dynamatic Tech. has average management risk and below-average growth and capital structure.

Peers: The peers of Dynamatic Tech. are Tega Inds., Titagarh Rail, Jupiter Wagons, Elecon Engg.Co, Kennametal India, Standard Enginee, Praj Industries, Centum Electron, and Cyient DLM.<BR><BR>Quality Snapshot: Excellent management risk is observed at Tega Inds., Titagarh Rail, Jupiter Wagons, Elecon Engg.Co, Kennametal India, and Praj Industries, while Average management risk is found at Dynamatic Tech., Standard Enginee, Centum Electron, and Cyient DLM. Good growth is noted at Jupiter Wagons and Kennametal India, while Average growth is seen at Titagarh Rail, and the rest have Below Average growth. Excellent capital structure is present at Tega Inds., Jupiter Wagons, Elecon Engg.Co, Kennametal India, Standard Enginee, and Praj Industries, while Below Average capital structure is found at Dynamatic Tech. and Centum Electron.<BR><BR>Return Snapshot: Kennametal India has the highest 1-year return at 69.69%, while Elecon Engg.Co has the lowest at -21.90%. Dynamatic Tech.'s 1-year return of 65.59% is significantly higher than Elecon Engg.Co's. Additionally, Jupiter Wagons, Elecon Engg.Co, and Praj Industries all report negative six-month returns.

View full answer

How big is Dynamatic Tech.?

14-Aug-2026

As of 14th August, Dynamatic Technologies Ltd has a market capitalization of 7,582.71 Cr, with recent net sales of 1,675.22 Cr and a net profit of 42.43 Cr.

As of 14th August, Dynamatic Technologies Ltd has a market capitalization of 7,582.71 Cr, categorizing it as a Small Cap company.<BR><BR>In the latest four quarters, the company reported Net Sales of 1,675.22 Cr and a Net Profit of 42.43 Cr.<BR><BR>The latest annual period for the balance sheet is March 2025, with Shareholder's Funds amounting to 717.50 Cr and Total Assets of 1,650.28 Cr.

View full answer

Should I buy, sell or hold Dynamatic Technologies Ltd?

12-Aug-2026

When is the next results date for Dynamatic Technologies Ltd?

30-Jul-2026

The next results date for Dynamatic Technologies Ltd is 07 August 2026.

The next results date for Dynamatic Technologies Ltd is scheduled for 07 August 2026.

View full answer

Are Dynamatic Technologies Ltd latest results good or bad?

21-May-2026

Dynamatic Technologies Ltd's latest results show strong revenue growth, with a 117.68% increase in net profit for Q4 FY26, but declining operating and net profit margins raise concerns about profitability. The stock fell by 3.81% post-announcement, reflecting mixed investor sentiment.

Dynamatic Technologies Ltd's latest results present a mixed picture. On the positive side, the company reported a significant increase in net profit for Q4 FY26, rising by 117.68% quarter-on-quarter to ₹12.56 crore. Additionally, revenue reached a record ₹433.16 crore, marking a 1.95% increase from the previous quarter and a more impressive 13.79% growth year-on-year.<BR><BR>However, there are notable concerns. Despite the revenue growth, the operating margin decreased slightly to 11.22%, down 56 basis points from the previous quarter, indicating rising operational costs that are outpacing revenue growth. Furthermore, the net profit margin fell to 2.90%, down from 4.23% a year earlier, highlighting challenges in profitability.<BR><BR>The stock market reacted negatively to the results, with shares declining by 3.81% following the announcement, reflecting investor disappointment over the mixed performance. Overall, while the revenue growth is encouraging, the decline in profitability and margin compression raises questions about the company's ability to sustain its growth trajectory and manage costs effectively.

View full answer

Has Dynamatic Technologies Ltd declared dividend?

11-Feb-2026

Dynamatic Technologies Ltd has declared a 50% dividend, amounting to ₹2 per share, with an ex-date of February 13, 2026. The company has shown strong total returns across various periods, with a remarkable 1031.11% total return over the past five years.

Dynamatic Technologies Ltd has declared a 50% dividend.<BR><BR>Dividend Details:<BR>- Percentage announced: 50%<BR>- Amount per share: 2 per share<BR>- Ex-date: 13 Feb 26<BR><BR>Dividend Yield: 0%<BR><BR>Total Returns by Period:<BR>In the 3-month period, the company experienced a price return of 1.96%, a dividend return of 0.05%, leading to a total return of 2.01%.<BR><BR>Over the 6-month period, the price return was 39.74%, with a dividend return of 0.08%, resulting in a total return of 39.82%.<BR><BR>For the 1-year period, the price return stood at 40.26%, the dividend return was 0.08%, culminating in a total return of 40.34%.<BR><BR>In the 2-year period, the price return was 32.31%, the dividend return reached 0.24%, giving a total return of 32.55%.<BR><BR>During the 3-year period, the price return soared to 244.09%, with a dividend return of 0.95%, leading to an impressive total return of 245.04%.<BR><BR>In the 4-year period, the price return was 333.87%, the dividend return was 1.42%, resulting in a total return of 335.29%.<BR><BR>Finally, in the 5-year period, the price return was an extraordinary 1028.21%, with a dividend return of 2.90%, yielding a total return of 1031.11%.<BR><BR>Overall, Dynamatic Technologies Ltd has declared a significant dividend while demonstrating strong total returns across all periods, particularly impressive over the longer term, indicating robust performance and shareholder value creation.

View full answer

Is Dynamatic Tech. overvalued or undervalued?

05-Dec-2025

As of December 4, 2025, Dynamatic Tech. is considered expensive with a PE ratio of 163.33 and an EV to EBITDA of 39.52, indicating overvaluation compared to peers like Hindustan Aeronautics and Bharat Electronics, despite a 1-year stock return of 7.12% that outperformed the Sensex's 5.32%.

As of 4 December 2025, the valuation grade for Dynamatic Tech. has moved from very expensive to expensive, indicating a slight improvement in perceived value but still reflecting high valuation metrics. The company is currently considered overvalued. Key ratios include a PE ratio of 163.33, an EV to EBITDA of 39.52, and a ROE of 4.66%. <BR><BR>In comparison to its peers, Dynamatic Tech. has a significantly higher PE ratio than Hindustan Aeronautics at 35.49 and Bharat Electronics at 52.22, both of which are also classified as very expensive. The company's recent stock performance shows a 1-year return of 7.12%, outperforming the Sensex's 5.32%, which may suggest some investor confidence despite the high valuation.

View full answer

Is Dynamatic Tech. technically bullish or bearish?

03-Dec-2025

As of December 2, 2025, the technical trend is mildly bullish, supported by bullish MACD and moving averages, but tempered by mixed signals from the KST and Dow Theory.

As of 2 December 2025, the technical trend has changed from bullish to mildly bullish. The current stance is mildly bullish, supported by a bullish MACD on both weekly and monthly time frames, and bullish moving averages on the daily chart. However, the KST shows a mixed signal with weekly bullishness and monthly mild bearishness, while Dow Theory indicates a mildly bearish stance on the weekly chart. The Bollinger Bands are also mildly bullish on both weekly and monthly time frames. Overall, the strength of the bullish stance is tempered by some mixed signals, particularly from the KST and Dow Theory.

View full answer

How has been the historical performance of Dynamatic Tech.?

12-Nov-2025

Dynamatic Tech. has shown fluctuating financial performance, with net sales decreasing slightly to 1,403.80 Cr in Mar'25 from 1,429.33 Cr in Mar'24, while profit after tax dropped significantly to 43.04 Cr. However, cash flow from operating activities improved to 144.00 Cr in Mar'25.

Answer:<BR>The historical performance of Dynamatic Tech. shows a fluctuating trend in key financial metrics over the years.<BR><BR>Breakdown:<BR>Dynamatic Tech. reported net sales of 1,403.80 Cr in Mar'25, a slight decrease from 1,429.33 Cr in Mar'24, but an increase from 1,315.77 Cr in Mar'23. The total operating income followed a similar pattern, reaching 1,403.80 Cr in Mar'25. The total expenditure, excluding depreciation, was 1,245.48 Cr in Mar'25, down from 1,269.92 Cr in Mar'24. Operating profit (PBDIT) for Mar'25 was 181.12 Cr, a decrease from 202.23 Cr in the previous year. Profit before tax was 55.11 Cr in Mar'25, down from 135.63 Cr in Mar'24, while profit after tax was 43.04 Cr, significantly lower than 121.81 Cr in Mar'24. The company’s total liabilities increased to 1,650.28 Cr in Mar'25 from 1,572.25 Cr in Mar'24, with total debt slightly decreasing to 451.04 Cr. Cash flow from operating activities improved to 144.00 Cr in Mar'25 from 97.00 Cr in Mar'24, although the net cash outflow was -17.00 Cr. Overall, the financial performance reflects a mix of challenges and improvements across various metrics over the years.

View full answer

How has been the historical performance of Dynamatic Tech.?

12-Nov-2025

Dynamatic Tech. experienced fluctuating financial performance, with net sales decreasing to 1,403.80 Cr in March 2025 from 1,429.33 Cr in March 2024, and profit after tax falling to 43.04 Cr from 121.81 Cr. Despite improvements in expenditure and cash flow, the company struggled with profitability and sales growth during this period.

Answer:<BR>The historical performance of Dynamatic Tech. shows fluctuations in key financial metrics over the years leading up to March 2025.<BR><BR>Breakdown:<BR>Dynamatic Tech. reported net sales of 1,403.80 Cr in March 2025, a slight decrease from 1,429.33 Cr in March 2024, following a rise from 1,315.77 Cr in March 2023. The total operating income mirrored this trend, reaching 1,403.80 Cr in March 2025. The company's total expenditure, excluding depreciation, was 1,245.48 Cr in March 2025, down from 1,269.92 Cr in March 2024. Operating profit (PBDIT) for March 2025 was 181.12 Cr, a decline from 202.23 Cr in the previous year, while profit before tax decreased to 55.11 Cr from 135.63 Cr. Consequently, profit after tax also fell to 43.04 Cr in March 2025 from 121.81 Cr in March 2024. The company's total liabilities increased to 1,650.28 Cr in March 2025, compared to 1,572.25 Cr in March 2024, with total debt slightly decreasing to 451.04 Cr. On the cash flow front, the net cash outflow was 17.00 Cr in March 2025, an improvement from the outflow of 87.00 Cr in March 2024, with cash and cash equivalents at the end of March 2025 standing at 33.00 Cr. Overall, while there were some positive trends in expenditure and cash flow, the company faced challenges in maintaining profitability and sales growth during this period.

View full answer

Who are the top shareholders of the Dynamatic Tech.?

06-Jun-2025

The top shareholders of Dynamatic Tech include Jkm Holdings Private Limited with 16.38%, 9 mutual fund schemes holding 6.61%, 57 foreign institutional investors with 13.29%, and HDFC Trustee Company Limited at 5.45%, while individual investors collectively own 21.57%.

The top shareholders of Dynamatic Tech. include a mix of promoters, institutional investors, and individual investors. The majority shareholders are the promoters, with Jkm Holdings Private Limited holding the highest stake at 16.38%. <BR><BR>In terms of institutional holdings, 9 mutual fund schemes collectively hold 6.61%, while 57 foreign institutional investors (FIIs) have a combined holding of 13.29%. The highest public shareholder is HDFC Trustee Company Limited, specifically through HDFC Infrastructure, which holds 5.45%. Individual investors collectively account for 21.57% of the shares.

View full answer
iScoreScore
Click here to find our call on this stock
Strong Sell
Sell
Hold
Buy
Strong Buy

Dashboard

1

Weak Long Term Fundamental Strength with an average Return on Capital Employed (ROCE) of 8.30%

  • Poor long term growth as Net Sales has grown by an annual rate of 5.17% and Operating profit at 7.31% over the last 5 years
  • Low ability to service debt as the company has a high Debt to EBITDA ratio of 3.49 times
2

With ROCE of 7.8, it has a Very Expensive valuation with a 6 Enterprise value to Capital Employed

stock-summaryMojo Parameters

Mojo Parameters

Loading Valuation Snapshot...

Stock DNA

stock-summary
Industry

Industrial Manufacturing

stock-summary
Market cap

INR 7,335 Cr (Small Cap)

stock-summary
P/E

127.00

stock-summary
Industry P/E

45

stock-summary
Dividend Yield

0.04%

stock-summary
Debt Equity

0.72

stock-summary
Return on Equity

6.30%

stock-summary
Price to Book

9.27

Revenue and Profits:
Net Sales:
425 Cr
(Quarterly Results - Jun 2026)
Net Profit:
21 Cr
stock-summaryTotal Returns
Total Returns (Price + Dividend) stock-summary
Dividend Yield (0.04%)
TimePeriod
Price Return
Dividend Return
Total Return
3 Months
3.24%
0.08%
3.32%
6 Months
18.63%
0.08%
18.71%
1 Year
73.8%
0.20%
74.0%
2 Years
65.97%
0.20%
66.17%
3 Years
187.86%
0.65%
188.51%
4 Years
504.74%
1.42%
506.16%
5 Years
424.46%
1.10%
425.56%

Latest dividend: 3 per share ex-dividend date: Aug-14-2026

Risk Adjusted Returns v/s stock-summary
Returns Beta
Icon
Beta has not been calculated since enough price history is not available
stock-summaryNews & Corporate Actions

News

Announcements stock-summary

Announcement under Regulation 30 (LODR)-Newspaper Publication

10-Aug-2026 | Source : BSE

Result - Copy of News paper publication

Announcement under Regulation 30 (LODR)-Investor Presentation

08-Aug-2026 | Source : BSE

Financial Result - Investor Presentation

Board Meeting Outcome for Board Meeting Outcome

07-Aug-2026 | Source : BSE

Board Meeting Outcome

Corporate Actions stock-summary

stock-summary
BOARD MEETING

No Upcoming Board Meetings

stock-summary
DIVIDEND

Dynamatic Technologies Ltd has declared 50% dividend, ex-date: 28 Aug 26

stock-summary
SPLITS

No Splits history available

stock-summary
BONUS

No Bonus history available

stock-summary
RIGHTS

No Rights history available

stock-summaryKey Factors

Quality key factors stock-summary

Factor
Value
Sales Growth (5y)
5.17%
EBIT Growth (5y)
7.31%
EBIT to Interest (avg)
1.68
Debt to EBITDA (avg)
3.80
Net Debt to Equity (avg)
0.72
Sales to Capital Employed (avg)
1.13
Tax Ratio
30.73%
Dividend Payout Ratio
3.16%
Pledged Shares
0
Institutional Holding
26.11%
ROCE (avg)
8.34%
ROE (avg)
6.72%

Valuation key factors

Factor
Value
P/E Ratio
127
Industry P/E
45
Price to Book Value
9.61
EV to EBIT
67.05
EV to EBITDA
40.96
EV to Capital Employed
6.01
EV to Sales
4.89
PEG Ratio
3.06
Dividend Yield
0.07%
ROCE (Latest)
7.78%
ROE (Latest)
6.30%

Technicals key factors

Indicator
Weekly
Monthly
MACD
Mildly Bearish
Bullish
RSI
No Signal
No Signal
Bollinger Bands
Mildly Bullish
Bullish
Moving Averages
Bullish (Daily)
KST
Mildly Bearish
Bullish
Dow Theory
Mildly Bullish
Mildly Bearish
OBV
Mildly Bearish
Mildly Bearish
stock-summary Technical Indicator Scale: Bearish, Mildly Bearish, Sideways, Mildly Bullish, Bullish  Turned 
stock-summaryShareholding
Shareholding Snapshot : Jun 2026stock-summary
Shareholding Compare (%holding) stock-summary
Majority shareholders

Promoters

Pledged Promoter Holdings

None

Mutual Funds

Held by 11 Schemes (8.31%)

FIIs

Held by 51 FIIs (10.26%)

Promoter with highest holding

Jkm Holdings Private Limited (16.38%)

Highest Public shareholder

Hdfc Trustee Company Limited - Hdfc Infrastructure (5.32%)

Individual Investors Holdings

23.13%

stock-summaryFinancial
[
  {
    "link": "quarterly",
    "btn_text": "All Quarterly Results",
    "header": "Quarterly Results Snapshot (Consolidated) - Jun'26 - QoQ",
    "rhs": [
      {
        "prefix": "Net Sales ",
        "suffix": "QoQ Growth in quarter ended Jun 2026 is -1.93% vs 1.95% in Mar 2026",
        "dir": -1
      },
      {
        "prefix": "Consolidated Net Profit ",
        "suffix": "QoQ Growth in quarter ended Jun 2026 is 65.53% vs 117.68% in Mar 2026",
        "dir": -1
      }
    ],
    "table": {
      "header": [
        "Jun'26",
        "Mar'26",
        "Change(%)"
      ],
      "body": [
        {
          "field": "Net Sales",
          "val1": "424.81",
          "val2": "433.16",
          "chgp": "-1.93%",
          "chgp_class": "negative"
        },
        {
          "field": "Operating Profit (PBDIT) excl Other Income",
          "val1": "55.11",
          "val2": "48.61",
          "chgp": "13.37%",
          "chgp_class": "positive"
        },
        {
          "field": "Interest",
          "val1": "14.92",
          "val2": "14.48",
          "chgp": "3.04%",
          "chgp_class": "negative"
        },
        {
          "field": "Exceptional Items",
          "val1": "0.00",
          "val2": "-6.42",
          "chgp": "100.00%",
          "chgp_class": "positive"
        },
        {
          "field": "Consolidate Net Profit",
          "val1": "20.79",
          "val2": "12.56",
          "chgp": "65.53%",
          "chgp_class": "positive"
        },
        {
          "field": "Operating Profit Margin (Excl OI)",
          "val1": "12.97%",
          "val2": "11.22%",
          "chgp": "1.75%",
          "chgp_class": "positive"
        }
      ]
    }
  },
  {
    "link": "half-yearly",
    "btn_text": "All Half Yearly Results",
    "header": "Half Yearly Results Snapshot (Consolidated) - Sep'25",
    "rhs": [
      {
        "prefix": "Net Sales ",
        "suffix": " Growth in half year ended Sep 2025 is 7.86% vs -0.80% in Sep 2024",
        "dir": 1
      },
      {
        "prefix": "Consolidated Net Profit ",
        "suffix": " Growth in half year ended Sep 2025 is -39.88% vs -56.19% in Sep 2024",
        "dir": 1
      }
    ],
    "table": {
      "header": [
        "Sep'25",
        "Sep'24",
        "Change(%)"
      ],
      "body": [
        {
          "field": "Net Sales",
          "val1": "763.31",
          "val2": "707.70",
          "chgp": "7.86%",
          "chgp_class": "positive"
        },
        {
          "field": "Operating Profit (PBDIT) excl Other Income",
          "val1": "84.02",
          "val2": "81.09",
          "chgp": "3.61%",
          "chgp_class": "positive"
        },
        {
          "field": "Interest",
          "val1": "29.46",
          "val2": "28.74",
          "chgp": "2.51%",
          "chgp_class": "negative"
        },
        {
          "field": "Exceptional Items",
          "val1": "-6.88",
          "val2": "0.00",
          "chgp": "",
          "chgp_class": "neutral"
        },
        {
          "field": "Consolidate Net Profit",
          "val1": "14.08",
          "val2": "23.42",
          "chgp": "-39.88%",
          "chgp_class": "negative"
        },
        {
          "field": "Operating Profit Margin (Excl OI)",
          "val1": "11.01%",
          "val2": "11.46%",
          "chgp": "-0.45%",
          "chgp_class": "negative"
        }
      ]
    }
  },
  {
    "link": "nine-monthly",
    "btn_text": "All Nine Monthly Results",
    "header": "Nine Monthly Results Snapshot (Consolidated) - Dec'25",
    "rhs": [
      {
        "prefix": "Net Sales ",
        "suffix": "YoY Growth in nine months ended Dec 2025 is 16.13% vs -3.38% in Dec 2024",
        "dir": 1
      },
      {
        "prefix": "Consolidated Net Profit ",
        "suffix": "YoY Growth in nine months ended Dec 2025 is -26.35% vs -58.35% in Dec 2024",
        "dir": 1
      }
    ],
    "table": {
      "header": [
        "Dec'25",
        "Dec'24",
        "Change(%)"
      ],
      "body": [
        {
          "field": "Net Sales",
          "val1": "1,188.18",
          "val2": "1,023.13",
          "chgp": "16.13%",
          "chgp_class": "positive"
        },
        {
          "field": "Operating Profit (PBDIT) excl Other Income",
          "val1": "134.07",
          "val2": "120.38",
          "chgp": "11.37%",
          "chgp_class": "positive"
        },
        {
          "field": "Interest",
          "val1": "43.53",
          "val2": "42.74",
          "chgp": "1.85%",
          "chgp_class": "negative"
        },
        {
          "field": "Exceptional Items",
          "val1": "-21.15",
          "val2": "0.00",
          "chgp": "",
          "chgp_class": "neutral"
        },
        {
          "field": "Consolidate Net Profit",
          "val1": "19.85",
          "val2": "26.95",
          "chgp": "-26.35%",
          "chgp_class": "negative"
        },
        {
          "field": "Operating Profit Margin (Excl OI)",
          "val1": "11.28%",
          "val2": "11.77%",
          "chgp": "-0.49%",
          "chgp_class": "negative"
        }
      ]
    }
  },
  {
    "link": "annual",
    "btn_text": "All Annual Results",
    "header": "Annual Results Snapshot (Consolidated) - Mar'26",
    "rhs": [
      {
        "prefix": "Net Sales ",
        "suffix": "YoY Growth in year ended Mar 2026 is 15.50% vs -1.79% in Mar 2025",
        "dir": 1
      },
      {
        "prefix": "Consolidated Net Profit ",
        "suffix": "YoY Growth in year ended Mar 2026 is -24.70% vs -64.67% in Mar 2025",
        "dir": 1
      }
    ],
    "table": {
      "header": [
        "Mar'26",
        "Mar'25",
        "Change(%)"
      ],
      "body": [
        {
          "field": "Net Sales",
          "val1": "1,621.34",
          "val2": "1,403.80",
          "chgp": "15.50%",
          "chgp_class": "positive"
        },
        {
          "field": "Operating Profit (PBDIT) excl Other Income",
          "val1": "182.68",
          "val2": "158.32",
          "chgp": "15.39%",
          "chgp_class": "positive"
        },
        {
          "field": "Interest",
          "val1": "58.01",
          "val2": "56.72",
          "chgp": "2.27%",
          "chgp_class": "negative"
        },
        {
          "field": "Exceptional Items",
          "val1": "-27.57",
          "val2": "0.00",
          "chgp": "",
          "chgp_class": "neutral"
        },
        {
          "field": "Consolidate Net Profit",
          "val1": "32.41",
          "val2": "43.04",
          "chgp": "-24.70%",
          "chgp_class": "negative"
        },
        {
          "field": "Operating Profit Margin (Excl OI)",
          "val1": "11.27%",
          "val2": "11.28%",
          "chgp": "-0.01%",
          "chgp_class": "negative"
        }
      ]
    }
  }
]

Quarterly Results Snapshot (Consolidated) - Jun'26 - QoQstock-summary

Jun'26
Mar'26
Change(%)
Net Sales
424.81
433.16
-1.93%
Operating Profit (PBDIT) excl Other Income
55.11
48.61
13.37%
Interest
14.92
14.48
3.04%
Exceptional Items
0.00
-6.42
100.00%
Consolidate Net Profit
20.79
12.56
65.53%
Operating Profit Margin (Excl OI)
12.97%
11.22%
1.75%
Values in Rs Cr.
Direction Arrows
Net Sales

QoQ Growth in quarter ended Jun 2026 is -1.93% vs 1.95% in Mar 2026

Direction Arrows
Consolidated Net Profit

QoQ Growth in quarter ended Jun 2026 is 65.53% vs 117.68% in Mar 2026

Half Yearly Results Snapshot (Consolidated) - Sep'25stock-summary

Sep'25
Sep'24
Change(%)
Net Sales
763.31
707.70
7.86%
Operating Profit (PBDIT) excl Other Income
84.02
81.09
3.61%
Interest
29.46
28.74
2.51%
Exceptional Items
-6.88
0.00
Consolidate Net Profit
14.08
23.42
-39.88%
Operating Profit Margin (Excl OI)
11.01%
11.46%
-0.45%
Values in Rs Cr.
Direction Arrows
Net Sales

Growth in half year ended Sep 2025 is 7.86% vs -0.80% in Sep 2024

Direction Arrows
Consolidated Net Profit

Growth in half year ended Sep 2025 is -39.88% vs -56.19% in Sep 2024

Nine Monthly Results Snapshot (Consolidated) - Dec'25stock-summary

Dec'25
Dec'24
Change(%)
Net Sales
1,188.18
1,023.13
16.13%
Operating Profit (PBDIT) excl Other Income
134.07
120.38
11.37%
Interest
43.53
42.74
1.85%
Exceptional Items
-21.15
0.00
Consolidate Net Profit
19.85
26.95
-26.35%
Operating Profit Margin (Excl OI)
11.28%
11.77%
-0.49%
Values in Rs Cr.
Direction Arrows
Net Sales

YoY Growth in nine months ended Dec 2025 is 16.13% vs -3.38% in Dec 2024

Direction Arrows
Consolidated Net Profit

YoY Growth in nine months ended Dec 2025 is -26.35% vs -58.35% in Dec 2024

Annual Results Snapshot (Consolidated) - Mar'26stock-summary

Mar'26
Mar'25
Change(%)
Net Sales
1,621.34
1,403.80
15.50%
Operating Profit (PBDIT) excl Other Income
182.68
158.32
15.39%
Interest
58.01
56.72
2.27%
Exceptional Items
-27.57
0.00
Consolidate Net Profit
32.41
43.04
-24.70%
Operating Profit Margin (Excl OI)
11.27%
11.28%
-0.01%
Values in Rs Cr.
Direction Arrows
Net Sales

YoY Growth in year ended Mar 2026 is 15.50% vs -1.79% in Mar 2025

Direction Arrows
Consolidated Net Profit

YoY Growth in year ended Mar 2026 is -24.70% vs -64.67% in Mar 2025

stock-summaryCompany CV
About Dynamatic Technologies Ltd stock-summary

stock-summary
Dynamatic Technologies Ltd
Small Cap
Industrial Manufacturing
Dynamatic Technologies Limited (DTL) was formerly incorporated in 1973 in the name of 'Dynamatic Hydraulics Limited'. In 1992, the name of the Company was changed to Dynamatic Technologies Limited. The Company was floated by J K Malhoutra. The Company is manufacturer of highly engineered, mission critical products for the Aerospace, Automotive and Hydraulic industries. With futuristic design, engineering and manufacturing facilities in Europe and India, it serves customers across six continents.
Company Coordinates stock-summary
Company Details
Dynamatic Park, Peenya Bangalore Karnataka : 560058
stock-summary
Tel: 91-80-28394933/34/35
stock-summary
investor.relations@dynamatics.net
Registrar Details
Karvy Computershare Pvt Ltd., Karvy Selenium, Tower-B Plot No 31 & 32, Survey No 116/22, 115/24, 115/25, Financial District, Nanakramguda, Serilingampally, Mandal Ranga Reddy Dist, Hyderabad