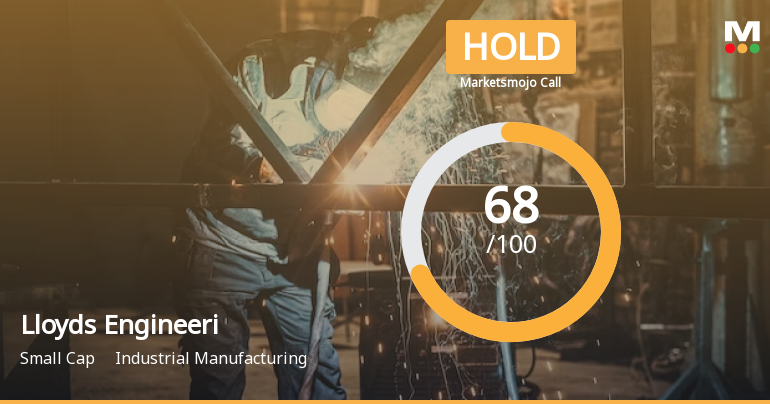
Lloyds Engineeri

  • Market Cap: Small Cap
  • Industry: Industrial Manufacturing
  • ISIN: INE093R01011
  • NSEID: LLOYDSENGG
  • BSEID: 539992
INR
85.73
-1.44 (-1.65%)
BSENSE

Aug 25, 03:30 PM

BSE+NSE Vol: 80.23 lacs

  • Price Points
  • Score
  • Mojo Parameters
  • Total Return
  • News and Corporate Actions
  • Key factors
  • Shareholding
  • Financials
  • CompanyCV
stock-summaryPrice Point
High/Low

1Day

52 Week

Valuation
Technical
Day's Volume

CASH

80.23 lacs (13.39%) Volume

Shareholding (Jul 2026)

FII

2.02%

Held by 56 FIIs

DII

0.30%

Held by 4 DIIs

Promoter

41.91%

Why is Lloyds Engineering Works Ltd falling/rising?

25-Aug-2026

As of 24-Aug, Lloyds Engineering Works Ltd's stock price has declined to 87.22, reflecting a drop of -3.13%. This decline is due to underperformance against its sector, consecutive losses over the past four days, and bearish short-term trends, despite strong long-term returns.

As of 24-Aug, Lloyds Engineering Works Ltd is experiencing a decline in its stock price, currently at 87.22, which reflects a change of -2.82 (-3.13%). This drop can be attributed to several factors. Firstly, the stock has underperformed its sector by -4.32% today and has been on a consecutive decline for the last four days, accumulating a total loss of -6.45% during this period. Additionally, the stock reached an intraday low of Rs 86.6, indicating significant selling pressure.<BR><BR>Despite the company's strong long-term performance, including a remarkable year-to-date return of +55.61% and a five-year return of +3643.35%, the recent short-term trends are concerning. The stock's performance over the past week shows a decline of -4.44%, while the benchmark Sensex has only decreased by -0.46%. Furthermore, while the stock is trading above its 100-day and 200-day moving averages, it is below its 5-day, 20-day, and 50-day moving averages, suggesting a bearish trend in the short term.<BR><BR>Investor participation has increased, with a delivery volume rise of 35.53% against the five-day average, indicating some interest in the stock. However, the overall liquidity remains adequate for trading, with a value of Rs 1.31 crore based on 2% of the five-day average traded value. The combination of recent performance trends, sector underperformance, and the stock's consecutive declines contribute to the current falling price of Lloyds Engineering Works Ltd.

View full answer

Should I buy, sell or hold Lloyds Engineering Works Ltd?

24-Aug-2026

Who are in the management team of Lloyds Engineeri?

14-Aug-2026

The management team of Lloyds Engineeri includes Mukesh R Gupta (Chairman & Wholetime Director), Ashok Satyanarayan Tandon, Rajashekhar M Alegavi, Kishore Kumar Mohanlal Pradhan (all Directors), Meenakshi Ankit Pansari (Company Secretary & Compliance Officer), and three Independent Directors: Bela Sundar Rajan, Ananthsubramanian Lakshman, and Ashok Kumar Sharma. This team offers a diverse range of expertise and leadership.

The management team of Lloyds Engineeri includes the following individuals:<BR><BR>1. **Mukesh R Gupta** - Chairman & Wholetime Director<BR>2. **Ashok Satyanarayan Tandon** - Director<BR>3. **Rajashekhar M Alegavi** - Director<BR>4. **Kishore Kumar Mohanlal Pradhan** - Director<BR>5. **Meenakshi Ankit Pansari** - Company Secretary & Compliance Officer<BR>6. **Bela Sundar Rajan** - Independent Director<BR>7. **Ananthsubramanian Lakshman** - Independent Director<BR>8. **Ashok Kumar Sharma** - Independent Director<BR><BR>This team brings a diverse range of expertise and leadership to the company.

View full answer

What does Lloyds Engineeri do?

14-Aug-2026

Lloyds Engineering Works Ltd is a small-cap industrial manufacturing company, incorporated in 1994, with recent quarterly net sales of 527 Cr and net profit of 64 Cr as of June 2026. The company has a market cap of INR 13,589 Cr and key financial metrics include a P/E ratio of 60.00 and a return on equity of 11.36%.

Overview:<BR>Lloyds Engineering Works Ltd operates in the industrial manufacturing sector and is categorized as a small-cap company.<BR><BR>History:<BR>The company was incorporated in 1994 as "Climan Properties Private Limited" and later converted to a public limited company, changing its name to "Climan Properties Limited" in 2000. The latest quarterly results reported net sales and net profit for June 2026.<BR><BR>Financial Snapshot:<BR>- Net Sales: 527 Cr (Quarterly Results - Jun 2026)<BR>- Net Profit: 64 Cr (Quarterly Results - Jun 2026)<BR>- Market Cap: INR 13,589 Cr (Small Cap)<BR><BR>Key Metrics:<BR>- P/E: 60.00<BR>- Industry P/E: 24<BR>- Dividend Yield: 0.22%<BR>- Debt Equity: -0.17<BR>- Return on Equity: 11.36%<BR>- Price to Book: 8.07<BR><BR>Contact Details:<BR>Address: Plot No. A 5/5, MIDC Industrial Area Murbad Maharashtra : 421401<BR>Tel: 91-22-30418111<BR>Email: infoengg@lloyds.in<BR>Website: http://www.lloydsengg.in

View full answer

Who are the peers of the Lloyds Engineeri?

14-Aug-2026

Lloyds Engineeri's peers include Syrma SGS Tech., Kaynes Tech, LMW, Jyoti CNC Auto., Tega Inds., Titagarh Rail, Jupiter Wagons, Elecon Engg.Co, and Kennametal India. Syrma SGS Tech. leads in 1-year returns at 110.58%, while Lloyds Engineeri has a return of 28.30%.

Peers: The peers of Lloyds Engineeri are Syrma SGS Tech., Kaynes Tech, LMW, Jyoti CNC Auto., Tega Inds., Titagarh Rail, Jupiter Wagons, Elecon Engg.Co, and Kennametal India.<BR><BR>Quality Snapshot: Excellent management risk is observed at Jyoti CNC Auto., Tega Inds., Jupiter Wagons, Elecon Engg.Co, and Kennametal India, while Average management risk is found at Syrma SGS Tech., Kaynes Tech, LMW, and Lloyds Engineeri. Growth is excellent for Syrma SGS Tech., Kaynes Tech., and Lloyds Engineeri, while below average growth is noted for LMW and Tega Inds., with the rest showing average or below average growth. Capital structure is excellent for LMW, Jupiter Wagons, Elecon Engg.Co, and Kennametal India, while good capital structure is found at Syrma SGS Tech., Kaynes Tech., and Lloyds Engineeri, and average capital structure is observed at Titagarh Rail.<BR><BR>Return Snapshot: The peer with the highest 1-year return is Syrma SGS Tech. at 110.58%, while Kaynes Tech. has the lowest at -38.18%. Lloyds Engineeri's 1-year return of 28.30% is significantly higher than Kaynes Tech.'s but lower than Syrma SGS Tech.'s. Additionally, Tega Inds., Jupiter Wagons, Elecon Engg.Co, and Kaynes Tech. have negative six-month returns.

View full answer

How big is Lloyds Engineeri?

14-Aug-2026

As of 14th August, Lloyds Engineering Works Ltd has a market capitalization of 13,727.00 Cr and reported net sales of 1,611.28 Cr and net profit of 223.67 Cr over the last four quarters.

As of 14th August, <BR><BR>Market Cap: Lloyds Engineering Works Ltd has a market capitalization of 13,727.00 Cr, categorizing it as a Small Cap company.<BR><BR>Recent Quarterly Performance: The sum of Net Sales for the latest 4 quarters is 1,611.28 Cr, while the sum of Net Profit for the same period is 223.67 Cr.<BR><BR>Balance Sheet Snapshot: The reporting period is March 2026, with Shareholder's Funds amounting to 1,670.85 Cr and Total Assets totaling 2,364.67 Cr.

View full answer

When is the next results date for Lloyds Engineering Works Ltd?

04-Aug-2026

The next results date for Lloyds Engineering Works Ltd is August 6, 2026.

The next results date for Lloyds Engineering Works Ltd is scheduled for August 6, 2026.

View full answer

Are Lloyds Engineering Works Ltd latest results good or bad?

06-May-2026

Lloyds Engineering Works Ltd's latest results show strong revenue growth with net sales up 81.69% quarter-over-quarter, but profitability has declined, with net profit down 23.27% sequentially and margins contracting significantly. While revenue growth is positive, the high valuation and declining profitability suggest caution for potential investors.

Lloyds Engineering Works Ltd's latest results present a mixed picture. On one hand, the company achieved impressive revenue growth, with net sales reaching an all-time quarterly high of ₹495.02 crores, marking an 81.69% increase compared to the previous quarter and a 113.41% rise year-on-year. This strong revenue trajectory indicates robust order execution and market demand.<BR><BR>However, the profitability metrics have raised concerns. The consolidated net profit for Q4 FY26 was ₹46.83 crores, which represents a 23.27% decline sequentially, although it shows a significant 156.60% increase year-on-year. The operating margin has contracted sharply, falling to 12.36% from 19.42% in the previous quarter, and the PAT margin dropped from 20.62% to 7.87%. This margin compression is attributed to rising operational costs and a significantly higher tax rate.<BR><BR>Additionally, the company's valuation appears elevated, trading at 52 times trailing earnings, which is substantially higher than the sector average of 29 times. This high valuation, combined with declining margins and a 'SELL' rating from proprietary scoring models, suggests caution for potential investors.<BR><BR>In summary, while the revenue growth is commendable, the significant decline in profitability and high valuation metrics indicate that the results should be approached with caution. Existing investors may want to consider their positions carefully, especially in light of the recent volatility and mixed performance indicators.

View full answer

Is Lloyds Engineeri technically bullish or bearish?

14-Nov-2025

As of November 13, 2025, the technical trend has shifted to a bearish stance, driven by bearish MACD, Bollinger Bands, KST signals, and moving averages, despite some bullishness indicated by the monthly RSI.

As of 13 November 2025, the technical trend has changed from mildly bearish to bearish. The current technical stance is bearish with moderate strength. Key indicators driving this stance include a bearish MACD on the weekly chart, bearish signals from Bollinger Bands and KST on both weekly and monthly time frames, and bearish moving averages on the daily chart. The Dow Theory also indicates a mildly bearish trend on the weekly and monthly time frames. While the monthly RSI shows bullishness, it is overshadowed by the prevailing bearish indicators.

View full answer

How has been the historical performance of Lloyds Engineeri?

09-Nov-2025

Lloyds Engineeri reported a total operating income of 845.74 Cr and a profit after tax of 108.00 Cr for the year ending March 2025, with an operating profit margin of 15.98% and a consolidated net profit of 103.14 Cr. The company maintains a strong liquidity position with total current assets of 651.95 Cr against total liabilities of 981.26 Cr.

Answer:<BR>The historical performance of Lloyds Engineeri for the year ending March 2025 shows a total operating income of 845.74 Cr, with a total expenditure of 710.57 Cr, leading to an operating profit (PBDIT) of 135.17 Cr. After accounting for interest and depreciation, the profit before tax stands at 141.14 Cr, resulting in a profit after tax of 108.00 Cr. The consolidated net profit is reported at 103.14 Cr, with an earnings per share (EPS) of 0.78. The operating profit margin is 15.98%, while the profit after tax margin is 12.77%. <BR><BR>Breakdown:<BR>Lloyds Engineeri's financial results for March 2025 indicate a solid performance, with net sales reaching 845.74 Cr and total operating income matching this figure. The company incurred raw material costs of 428.43 Cr and other expenses totaling 124.85 Cr, contributing to a total expenditure of 710.57 Cr. This expenditure allowed for an operating profit (PBDIT) of 135.17 Cr, which, when combined with other income, results in a gross profit (PBDT) of 150.80 Cr. After deducting interest and depreciation, the profit before tax is 141.14 Cr, leading to a profit after tax of 108.00 Cr. The consolidated net profit is 103.14 Cr, supported by a book value per share of approximately 4.83. The company maintains a strong liquidity position with total current assets of 651.95 Cr against total liabilities of 981.26 Cr, reflecting a healthy financial structure.

View full answer

How has been the historical performance of Lloyds Engineeri?

09-Nov-2025

Lloyds Engineeri reported an operating income of 845.74 Cr and a profit after tax of 108.00 Cr for the year ending March 2025, with a consolidated net profit of 103.14 Cr and an EPS of 0.78. The company maintained a balanced financial position with total assets and liabilities of 981.26 Cr each.

Answer:<BR>The historical performance of Lloyds Engineeri for the year ending March 2025 shows a total operating income of 845.74 Cr, with a total expenditure of 710.57 Cr, resulting in an operating profit (PBDIT) of 135.17 Cr. After accounting for interest and depreciation, the profit before tax stands at 141.14 Cr, leading to a profit after tax of 108.00 Cr. The consolidated net profit is reported at 103.14 Cr, with an earnings per share (EPS) of 0.78. The operating profit margin is 15.98%, while the profit after tax margin is 12.77%. <BR><BR>Breakdown:<BR>In March 2025, Lloyds Engineeri achieved net sales of 845.74 Cr, with no other operating income reported. The company incurred raw material costs of 428.43 Cr and other expenses totaling 124.85 Cr, contributing to a total expenditure of 710.57 Cr. This resulted in an operating profit (PBDIT) of 135.17 Cr, which, when combined with other income of 24.16 Cr, led to an overall operating profit of 159.33 Cr. After deducting interest of 8.53 Cr and depreciation of 9.66 Cr, the profit before tax was 141.14 Cr, and after tax provisions of 33.14 Cr, the profit after tax was 108.00 Cr. The consolidated net profit, after accounting for minority interests and share in profit of associates, was 103.14 Cr. The company reported a book value per share of approximately 4.83 and maintained a total asset value of 981.26 Cr against total liabilities of the same amount, indicating a balanced financial position. Cash flow from operating activities was 158.00 Cr, while cash flow from investing and financing activities were negative at -108.00 Cr and -45.00 Cr respectively, resulting in a net cash inflow of 4.00 Cr by the end of the period.

View full answer

Who are the top shareholders of the Lloyds Engineeri?

17-Jul-2025

The top shareholders of Lloyds Engineering include Lloyds Enterprises Limited with 33.3%, individual investors holding 37.17%, and foreign institutional investors at 2.13%. Promoters hold 12.23% (with some pledged), while Thriveni Earthmovers Private Limited is the largest public shareholder at 1.82%.

The top shareholders of Lloyds Engineering include a mix of promoters, institutional investors, and individual shareholders. The largest shareholder is Lloyds Enterprises Limited, which holds 33.3% of the company. Promoters collectively hold a significant portion, with 12.23% of their holdings pledged. <BR><BR>In terms of institutional investment, mutual funds hold a small stake through 39 schemes, accounting for 0.16%, while foreign institutional investors (FIIs) hold 2.13% through 68 different entities. The highest public shareholder is Thriveni Earthmovers Private Limited, with a stake of 1.82%. Additionally, individual investors collectively hold 37.17% of the company.

View full answer

Is Lloyds Engineeri overvalued or undervalued?

09-Jun-2025

As of May 13, 2022, Lloyds Engineering is considered very expensive and overvalued, with a high PE ratio of 88.18 and significant premiums over its peers, despite a recent 1-month return of 20.58% that contrasts with a year-to-date decline of -11.16%.

As of 13 May 2022, the valuation grade for Lloyds Engineering moved from does not qualify to very expensive, indicating a significant shift in its perceived value. The company is currently overvalued, as reflected by its high PE ratio of 88.18, a Price to Book Value of 13.63, and an EV to EBITDA ratio of 70.78. These figures suggest that investors are paying a premium for the stock relative to its earnings and book value.<BR><BR>In comparison to its peers, Lloyds Engineering's PE ratio stands out significantly higher than the industry average, which typically ranges much lower. For instance, if we consider a peer like Company X with a PE of 20, Lloyds' valuation appears excessive. Furthermore, the company's recent stock performance shows a 1-month return of 20.58%, which outperformed the Sensex's 3.86%, yet the year-to-date return of -11.16% indicates a disconnect between current market sentiment and its elevated valuation.

View full answer

Has Lloyds Engineeri declared dividend?

06-Jun-2025

Lloyds Engineering Works Ltd has declared a 20% dividend, amounting to 0.2 per share, with an ex-date of July 19, 2024. While recent returns have been volatile, long-term performance shows substantial growth, with total returns of 8976.28% over the past five years.

Lloyds Engineering Works Ltd has declared a 20% dividend.<BR><BR>Dividend Details:<BR>- Percentage announced: 20%<BR>- Amount per share: 0.2<BR>- Ex-date: Jul-19-2024<BR><BR>Dividend Yield: 0.26%.<BR><BR>Total Returns by Period:<BR>In the last 6 months, the price return was -14.73%, with a dividend return of 0%, resulting in a total return of -14.73%.<BR><BR>Over the past year, the price return was 8.16%, the dividend return was 0.34%, leading to a total return of 8.5%.<BR><BR>In the 2-year period, the price return reached 164.97%, while the dividend return was 1.40%, culminating in a total return of 166.37%.<BR><BR>For the last 3 years, the price return was 508.82%, with a dividend return of 4.81%, resulting in a total return of 513.63%.<BR><BR>In the 4-year period, the price return was 3092.84%, and the dividend return was 11.78%, giving a total return of 3104.62%.<BR><BR>Over the past 5 years, the price return soared to 8946.37%, while the dividend return was 29.91%, leading to a total return of 8976.28%.<BR><BR>Overall, Lloyds Engineering Works Ltd has declared a significant dividend, and while the recent returns have shown volatility, the long-term returns over multiple periods indicate substantial growth.

View full answer
iScoreScore
Click here to find our call on this stock
Strong Sell
Sell
Hold
Buy
Strong Buy

Dashboard

1

The company is Net-Debt Free

 
2

Healthy long term growth as Net Sales has grown by an annual rate of 53.80% and Operating profit at 33.09%

 
3

With a growth in Net Profit of 146.76%, the company declared Outstanding results in Jun 26

4

With ROE of 11.4, it has a Very Expensive valuation with a 7.9 Price to Book Value

5

Market Beating performance in long term as well as near term

stock-summaryMojo Parameters

Mojo Parameters

Loading Valuation Snapshot...

Stock DNA

stock-summary
Industry

Industrial Manufacturing

stock-summary
Market cap

INR 13,364 Cr (Small Cap)

stock-summary
P/E

59.00

stock-summary
Industry P/E

24

stock-summary
Dividend Yield

0.27%

stock-summary
Debt Equity

-0.17

stock-summary
Return on Equity

11.36%

stock-summary
Price to Book

8.08

Revenue and Profits:
Net Sales:
527 Cr
(Quarterly Results - Jun 2026)
Net Profit:
64 Cr
stock-summaryTotal Returns
Total Returns (Price + Dividend) stock-summary
Dividend Yield (0.27%)
TimePeriod
Price Return
Dividend Return
Total Return
3 Months
14.87%
0.32%
15.19%
6 Months
74.11%
0.51%
74.62%
1 Year
26.17%
0.39%
26.56%
2 Years
21.02%
0.75%
21.77%
3 Years
139.14%
1.89%
141.03%
4 Years
585.84%
6.31%
592.15%
5 Years
3442.56%
31.55%
3474.11%

Latest dividend: 0.25 per share ex-dividend date: Aug-14-2026

Risk Adjusted Returns v/s stock-summary
Returns Beta
Icon
Beta has not been calculated since enough price history is not available
stock-summaryNews & Corporate Actions

News

Announcements stock-summary

Lloyds Steels Industries Limited - Resignation

21-Nov-2019 | Source : NSE

Lloyds Steels Industries Limited has informed the Exchange regarding Resignation of Mr Vishal Agarwal as Independent Director of the company w.e.f. November 21, 2019.

Lloyds Steels Industries Limited - Other General Purpose

18-Nov-2019 | Source : NSE

Lloyds Steels Industries Limited has informed the Exchange regarding disclosure of Related Party Transactions for the half year ended September 30, 2019 pursuant to Regulation (23)(9) of the SEBI (Listing Obligation and Disclosure Requirements) (Amendments) Regulations, 2018.

Lloyds Steels Industries Limited - Updates

31-Oct-2019 | Source : NSE

Lloyds Steels Industries Limited has informed the Exchange regarding 'PUBLICATION OF NOTICE OF BOARD MEETING TO BE HELD ON 07.11.2019'.

Corporate Actions stock-summary

stock-summary
BOARD MEETING

No Upcoming Board Meetings

stock-summary
DIVIDEND

Lloyds Engineering Works Ltd has declared 25% dividend, ex-date: 14 Aug 26

stock-summary
SPLITS

No Splits history available

stock-summary
BONUS

No Bonus history available

stock-summary
RIGHTS

Lloyds Engineering Works Ltd has announced 9:34 rights issue, ex-date: 28 Apr 25

stock-summaryKey Factors

Quality key factors stock-summary

Factor
Value
Sales Growth (5y)
53.80%
EBIT Growth (5y)
33.09%
EBIT to Interest (avg)
14.40
Debt to EBITDA (avg)
0.86
Net Debt to Equity (avg)
-0.17
Sales to Capital Employed (avg)
0.83
Tax Ratio
19.97%
Dividend Payout Ratio
28.25%
Pledged Shares
10.64%
Institutional Holding
2.31%
ROCE (avg)
14.50%
ROE (avg)
13.38%

Valuation key factors

Factor
Value
P/E Ratio
59
Industry P/E
24
Price to Book Value
7.94
EV to EBIT
63.95
EV to EBITDA
56.70
EV to Capital Employed
9.38
EV to Sales
8.05
PEG Ratio
1.04
Dividend Yield
0.28%
ROCE (Latest)
12.08%
ROE (Latest)
11.36%

Technicals key factors

Indicator
Weekly
Monthly
MACD
Mildly Bearish
Bullish
RSI
Bearish
No Signal
Bollinger Bands
Mildly Bullish
Mildly Bullish
Moving Averages
Mildly Bullish (Daily)
KST
Mildly Bearish
Mildly Bearish
Dow Theory
Mildly Bearish
Bullish
OBV
Mildly Bullish
Bullish
stock-summary Technical Indicator Scale: Bearish, Mildly Bearish, Sideways, Mildly Bullish, Bullish  Turned 
stock-summaryShareholding
Shareholding Snapshot : Jul 2026stock-summary
Shareholding Compare (%holding) stock-summary
Majority shareholders

Non Institution

Pledged Promoter Holdings

10.6381

Mutual Funds

Held by 40 Schemes (0.15%)

FIIs

Held by 56 FIIs (2.02%)

Promoter with highest holding

Lloyds Enterprises Limited (32.65%)

Highest Public shareholder

Thriveni Earthmovers Private Limited (9.05%)

Individual Investors Holdings

37.34%

stock-summaryFinancial
[
  {
    "link": "quarterly",
    "btn_text": "All Quarterly Results",
    "header": "Quarterly Results Snapshot (Standalone) - Jun'26 - YoY",
    "rhs": [
      {
        "prefix": "Net Sales ",
        "suffix": "YoY Growth in quarter ended Jun 2026 is 104.55% vs 28.45% in Jun 2025",
        "dir": 1
      },
      {
        "prefix": "Standalone Net Profit ",
        "suffix": "YoY Growth in quarter ended Jun 2026 is 146.76% vs -17.06% in Jun 2025",
        "dir": 1
      }
    ],
    "table": {
      "header": [
        "Jun'26",
        "Jun'25",
        "Change(%)"
      ],
      "body": [
        {
          "field": "Net Sales",
          "val1": "355.82",
          "val2": "173.95",
          "chgp": "104.55%",
          "chgp_class": "positive"
        },
        {
          "field": "Operating Profit (PBDIT) excl Other Income",
          "val1": "45.63",
          "val2": "23.83",
          "chgp": "91.48%",
          "chgp_class": "positive"
        },
        {
          "field": "Interest",
          "val1": "2.68",
          "val2": "1.35",
          "chgp": "98.52%",
          "chgp_class": "negative"
        },
        {
          "field": "Exceptional Items",
          "val1": "0.00",
          "val2": "0.00",
          "chgp": "",
          "chgp_class": "neutral"
        },
        {
          "field": "Standalone Net Profit",
          "val1": "43.43",
          "val2": "17.60",
          "chgp": "146.76%",
          "chgp_class": "positive"
        },
        {
          "field": "Operating Profit Margin (Excl OI)",
          "val1": "12.82%",
          "val2": "13.70%",
          "chgp": "-0.88%",
          "chgp_class": "negative"
        }
      ]
    }
  },
  {
    "link": "half-yearly",
    "btn_text": "All Half Yearly Results",
    "header": "Half Yearly Results Snapshot (Standalone) - Sep'25",
    "rhs": [
      {
        "prefix": "Net Sales ",
        "suffix": " Growth in half year ended Sep 2025 is 20.38% vs 47.97% in Sep 2024",
        "dir": -1
      },
      {
        "prefix": "Standalone Net Profit ",
        "suffix": " Growth in half year ended Sep 2025 is 3.32% vs 55.45% in Sep 2024",
        "dir": -1
      }
    ],
    "table": {
      "header": [
        "Sep'25",
        "Sep'24",
        "Change(%)"
      ],
      "body": [
        {
          "field": "Net Sales",
          "val1": "418.40",
          "val2": "347.57",
          "chgp": "20.38%",
          "chgp_class": "positive"
        },
        {
          "field": "Operating Profit (PBDIT) excl Other Income",
          "val1": "62.06",
          "val2": "56.99",
          "chgp": "8.90%",
          "chgp_class": "positive"
        },
        {
          "field": "Interest",
          "val1": "4.43",
          "val2": "3.01",
          "chgp": "47.18%",
          "chgp_class": "negative"
        },
        {
          "field": "Exceptional Items",
          "val1": "0.00",
          "val2": "0.00",
          "chgp": "",
          "chgp_class": "neutral"
        },
        {
          "field": "Standalone Net Profit",
          "val1": "50.80",
          "val2": "49.17",
          "chgp": "3.32%",
          "chgp_class": "positive"
        },
        {
          "field": "Operating Profit Margin (Excl OI)",
          "val1": "14.83%",
          "val2": "16.40%",
          "chgp": "-1.57%",
          "chgp_class": "negative"
        }
      ]
    }
  },
  {
    "link": "nine-monthly",
    "btn_text": "All Nine Monthly Results",
    "header": "Nine Monthly Results Snapshot (Standalone) - Dec'25",
    "rhs": [
      {
        "prefix": "Net Sales ",
        "suffix": "YoY Growth in nine months ended Dec 2025 is 10.93% vs 32.31% in Dec 2024",
        "dir": -1
      },
      {
        "prefix": "Standalone Net Profit ",
        "suffix": "YoY Growth in nine months ended Dec 2025 is -4.25% vs 41.12% in Dec 2024",
        "dir": -1
      }
    ],
    "table": {
      "header": [
        "Dec'25",
        "Dec'24",
        "Change(%)"
      ],
      "body": [
        {
          "field": "Net Sales",
          "val1": "640.36",
          "val2": "577.29",
          "chgp": "10.93%",
          "chgp_class": "positive"
        },
        {
          "field": "Operating Profit (PBDIT) excl Other Income",
          "val1": "98.40",
          "val2": "96.28",
          "chgp": "2.20%",
          "chgp_class": "positive"
        },
        {
          "field": "Interest",
          "val1": "7.82",
          "val2": "5.02",
          "chgp": "55.78%",
          "chgp_class": "negative"
        },
        {
          "field": "Exceptional Items",
          "val1": "0.00",
          "val2": "0.00",
          "chgp": "",
          "chgp_class": "neutral"
        },
        {
          "field": "Standalone Net Profit",
          "val1": "79.33",
          "val2": "82.85",
          "chgp": "-4.25%",
          "chgp_class": "negative"
        },
        {
          "field": "Operating Profit Margin (Excl OI)",
          "val1": "15.37%",
          "val2": "16.68%",
          "chgp": "-1.31%",
          "chgp_class": "negative"
        }
      ]
    }
  },
  {
    "link": "annual",
    "btn_text": "All Annual Results",
    "header": "Annual Results Snapshot (Standalone) - Mar'26",
    "rhs": [
      {
        "prefix": "Net Sales ",
        "suffix": "YoY Growth in year ended Mar 2026 is 39.22% vs 21.07% in Mar 2025",
        "dir": 1
      },
      {
        "prefix": "Standalone Net Profit ",
        "suffix": "YoY Growth in year ended Mar 2026 is 18.60% vs 24.90% in Mar 2025",
        "dir": -1
      }
    ],
    "table": {
      "header": [
        "Mar'26",
        "Mar'25",
        "Change(%)"
      ],
      "body": [
        {
          "field": "Net Sales",
          "val1": "1,052.22",
          "val2": "755.78",
          "chgp": "39.22%",
          "chgp_class": "positive"
        },
        {
          "field": "Operating Profit (PBDIT) excl Other Income",
          "val1": "150.93",
          "val2": "123.05",
          "chgp": "22.66%",
          "chgp_class": "positive"
        },
        {
          "field": "Interest",
          "val1": "10.73",
          "val2": "6.72",
          "chgp": "59.67%",
          "chgp_class": "negative"
        },
        {
          "field": "Exceptional Items",
          "val1": "0.00",
          "val2": "0.00",
          "chgp": "",
          "chgp_class": "neutral"
        },
        {
          "field": "Standalone Net Profit",
          "val1": "118.27",
          "val2": "99.72",
          "chgp": "18.60%",
          "chgp_class": "positive"
        },
        {
          "field": "Operating Profit Margin (Excl OI)",
          "val1": "14.34%",
          "val2": "16.28%",
          "chgp": "-1.94%",
          "chgp_class": "negative"
        }
      ]
    }
  }
]

Quarterly Results Snapshot (Standalone) - Jun'26 - YoYstock-summary

Jun'26
Jun'25
Change(%)
Net Sales
355.82
173.95
104.55%
Operating Profit (PBDIT) excl Other Income
45.63
23.83
91.48%
Interest
2.68
1.35
98.52%
Exceptional Items
0.00
0.00
Standalone Net Profit
43.43
17.60
146.76%
Operating Profit Margin (Excl OI)
12.82%
13.70%
-0.88%
Values in Rs Cr.
Direction Arrows
Net Sales

YoY Growth in quarter ended Jun 2026 is 104.55% vs 28.45% in Jun 2025

Direction Arrows
Standalone Net Profit

YoY Growth in quarter ended Jun 2026 is 146.76% vs -17.06% in Jun 2025

Half Yearly Results Snapshot (Standalone) - Sep'25stock-summary

Sep'25
Sep'24
Change(%)
Net Sales
418.40
347.57
20.38%
Operating Profit (PBDIT) excl Other Income
62.06
56.99
8.90%
Interest
4.43
3.01
47.18%
Exceptional Items
0.00
0.00
Standalone Net Profit
50.80
49.17
3.32%
Operating Profit Margin (Excl OI)
14.83%
16.40%
-1.57%
Values in Rs Cr.
Direction Arrows
Net Sales

Growth in half year ended Sep 2025 is 20.38% vs 47.97% in Sep 2024

Direction Arrows
Standalone Net Profit

Growth in half year ended Sep 2025 is 3.32% vs 55.45% in Sep 2024

Nine Monthly Results Snapshot (Standalone) - Dec'25stock-summary

Dec'25
Dec'24
Change(%)
Net Sales
640.36
577.29
10.93%
Operating Profit (PBDIT) excl Other Income
98.40
96.28
2.20%
Interest
7.82
5.02
55.78%
Exceptional Items
0.00
0.00
Standalone Net Profit
79.33
82.85
-4.25%
Operating Profit Margin (Excl OI)
15.37%
16.68%
-1.31%
Values in Rs Cr.
Direction Arrows
Net Sales

YoY Growth in nine months ended Dec 2025 is 10.93% vs 32.31% in Dec 2024

Direction Arrows
Standalone Net Profit

YoY Growth in nine months ended Dec 2025 is -4.25% vs 41.12% in Dec 2024

Annual Results Snapshot (Standalone) - Mar'26stock-summary

Mar'26
Mar'25
Change(%)
Net Sales
1,052.22
755.78
39.22%
Operating Profit (PBDIT) excl Other Income
150.93
123.05
22.66%
Interest
10.73
6.72
59.67%
Exceptional Items
0.00
0.00
Standalone Net Profit
118.27
99.72
18.60%
Operating Profit Margin (Excl OI)
14.34%
16.28%
-1.94%
Values in Rs Cr.
Direction Arrows
Net Sales

YoY Growth in year ended Mar 2026 is 39.22% vs 21.07% in Mar 2025

Direction Arrows
Standalone Net Profit

YoY Growth in year ended Mar 2026 is 18.60% vs 24.90% in Mar 2025

stock-summaryCompany CV
About Lloyds Engineering Works Ltd stock-summary
stock-summary
Lloyds Engineering Works Ltd
Small Cap
Industrial Manufacturing
Lloyds Engineering Works Limited was incorporated as "Climan Properties Private Limited" on September 19, 1994 as a Private Limited Company by the Registrar of Companies, Mumbai. Subsequently, Company converted into a Public Limited Company and the name was changed to "Climan Properties Limited" on April 17, 2000, vide a fresh Certificate of Incorporation issued by the Registrar of Companies, Mumbai.
Company Coordinates stock-summary
Company Details
Plot No. A 5/5, MIDC Industrial Area Murbad Maharashtra : 421401
stock-summary
Tel: 91-22-30418111
stock-summary
infoengg@lloyds.in
Registrar Details
Bigshare Services Pvt Ltd , E-2 , Ansa Industrial Estate, Saki Vihar Road, Saki Naka, Andheri (E), Mumbai