
Compare CIE Automotive with Similar Stocks
Dashboard
Company has a Debt to Equity ratio (avg) of 0.05 times
Healthy long term growth as Operating profit has grown by an annual rate 30.98%
Positive results in Mar 26
With ROE of 11, it has a Attractive valuation with a 2.4 Price to Book Value
High Institutional Holdings at 26.1%
Stock DNA
Auto Components & Equipments
INR 17,876 Cr (Small Cap)
21.00
42
1.48%
-0.17
11.05%
2.40
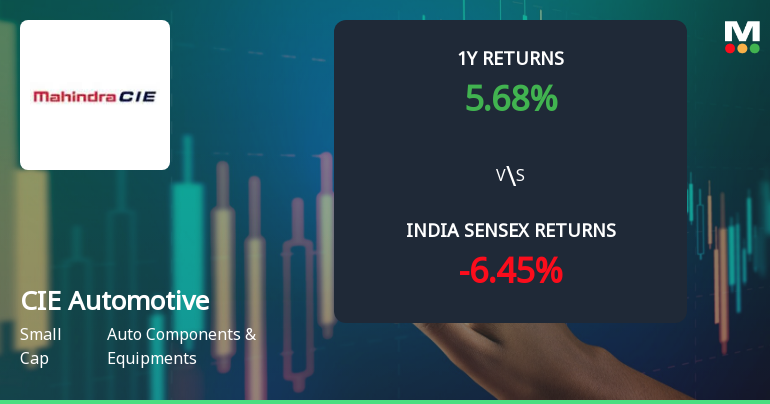
Total Returns (Price + Dividend) 
Latest dividend: 7 per share ex-dividend date: Apr-22-2026
Risk Adjusted Returns v/s
Returns Beta

News
CIE Automotive India Ltd Technical Momentum Shifts Signal Bullish Outlook
CIE Automotive India Ltd has demonstrated a notable shift in its technical momentum, moving from a mildly bullish stance to a more confident bullish trend. This transition is underpinned by a combination of key technical indicators, including MACD, RSI, moving averages, and Bollinger Bands, signalling renewed investor interest and potential upside in the auto components sector.
Read full news article
CIE Automotive India Ltd is Rated Buy
CIE Automotive India Ltd is rated 'Buy' by MarketsMOJO, with this rating last updated on 01 April 2026. However, the analysis and financial metrics presented here reflect the stock's current position as of 19 June 2026, providing investors with the most up-to-date view of the company’s fundamentals, returns, and market performance.
Read full news article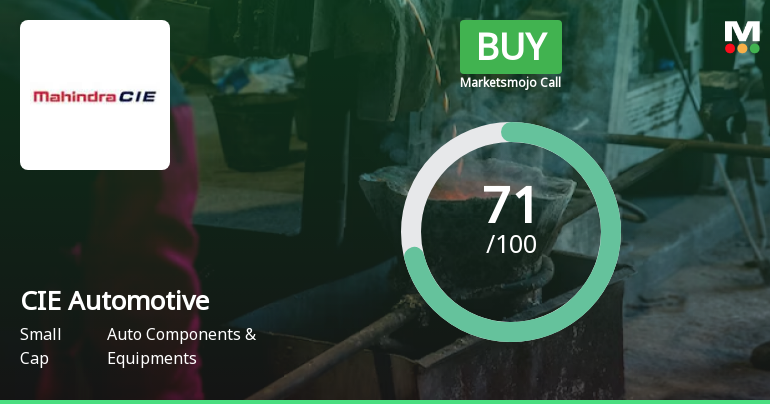
CIE Automotive India Ltd is Rated Buy
CIE Automotive India Ltd is rated 'Buy' by MarketsMOJO, with this rating last updated on 01 April 2026. However, the analysis and financial metrics discussed here reflect the stock's current position as of 08 June 2026, providing investors with the latest insights into the company’s performance and outlook.
Read full news article Announcements
Announcement under Regulation 30 (LODR)-Analyst / Investor Meet - Outcome
09-Jun-2026 | Source : BSEPursuant to Regulation 30 read with Para A of Schedule III and Regulation 46(2) of the Securities and Exchange Board of India (Listing Obligations and Disclosure Requirements) Regulations 2015 and our letter dated 12th May 2026 in respect of the advance intimation of upcoming Investor Relation Interactions please find enclosed herewith recording of the investor meeting held today i.e. 9th June 2026. The same is also being uploaded on the website of the Company i.e. https://www.cieindia.com/periodic-public-information8.html#Record-Of-Investor-Meetings Kindly acknowledge receipt and take the same on record.
Announcement under Regulation 30 (LODR)-Newspaper Publication
04-Jun-2026 | Source : BSENewspaper Publication - Opening of Special Window for Transfer and Dematerialisation of Physical Securities.
Announcement under Regulation 30 (LODR)-Analyst / Investor Meet - Outcome
02-Jun-2026 | Source : BSEPursuant to Regulation 30 read with Para A of Schedule III and Regulation 46(2) of the Securities and Exchange Board of India (Listing Obligations and Disclosure Requirements) Regulations 2015 and our letter dated 12th May 2026 in respect of the advance intimation of upcoming Investor Relation Interactions please find enclosed herewith recording of the investor meeting held today i.e. 2nd June 2026. The same is also being uploaded on the website of the Company i.e. https://www.cieindia.com/periodic-public-information8.html#Record-Of-Investor-Meetings Kindly acknowledge receipt and take the same on record.
Corporate Actions

No Upcoming Board Meetings

CIE Automotive India Ltd has declared 70% dividend, ex-date: 22 Apr 26

No Splits history available

No Bonus history available

No Rights history available
Quality key factors
Valuation key factors
Technicals key factors
 Technical Indicator Scale: Bearish, Mildly Bearish, Sideways, Mildly Bullish, Bullish Turned
 Shareholding Snapshot : Mar 2026
Shareholding Compare (%holding)
Promoters
None
Held by 19 Schemes (20.33%)
Held by 146 FIIs (4.73%)
Participaciones Internacionales Autometal, Dos S.l (65.7%)
Hdfc Trustee Company Limited Hdfc Flexi Cap Fund,hdfc Multi-asset Fun,hdfc Large And Mid Cap Fund,hd (9.75%)
5.99%
Quarterly Results Snapshot (Consolidated) - Mar'26 - YoY

YoY Growth in quarter ended Mar 2026 is 14.93% vs -6.35% in Mar 2025
YoY Growth in quarter ended Mar 2026 is 20.82% vs -10.45% in Mar 2025
Half Yearly Results Snapshot (Consolidated) - Jun'25

Growth in half year ended Jun 2025 is -1.65% vs -0.86% in Jun 2024
Growth in half year ended Jun 2025 is -8.35% vs -22.99% in Jun 2024
Nine Monthly Results Snapshot (Consolidated) - Sep'25
YoY Growth in nine months ended Sep 2025 is 2.32% vs -2.64% in Sep 2024
YoY Growth in nine months ended Sep 2025 is -2.90% vs -32.81% in Sep 2024
Annual Results Snapshot (Consolidated) - Dec'25
YoY Growth in year ended Dec 2025 is 4.94% vs -3.41% in Dec 2024
YoY Growth in year ended Dec 2025 is 0.08% vs -26.45% in Dec 2024
About CIE Automotive India Ltd

Company Coordinates


