
Compare Manappuram Fin. with Similar Stocks
Stock DNA
Non Banking Financial Company (NBFC)
INR 29,885 Cr (Small Cap)
30.00
21
0.58%
3.60
6.25%
1.87
Total Returns (Price + Dividend) 
Latest dividend: 0.4991024804177546 per share ex-dividend date: May-11-2026
Risk Adjusted Returns v/s
Returns Beta

News

Manappuram Finance Ltd is Rated Buy
Manappuram Finance Ltd is rated 'Buy' by MarketsMOJO, with this rating last updated on 19 May 2026. However, the analysis and financial metrics presented here reflect the stock's current position as of 22 June 2026, providing investors with the latest insights into its performance and outlook.
Read full news article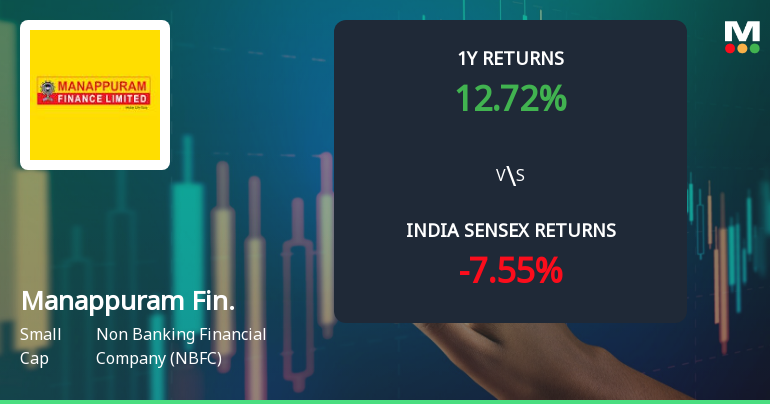
Manappuram Finance Ltd Technical Momentum Shifts Signal Bullish Outlook
Manappuram Finance Ltd has witnessed a notable shift in its technical momentum, with key indicators signalling an increasingly bullish trend. The stock’s recent price action, combined with improved moving averages and positive MACD readings, suggests growing investor confidence amid a small-cap NBFC sector backdrop.
Read full news article
Manappuram Finance Ltd is Rated Buy
Manappuram Finance Ltd is rated 'Buy' by MarketsMOJO, with this rating last updated on 19 May 2026. While the rating was revised on that date, the analysis and financial metrics discussed here reflect the stock's current position as of 11 June 2026, providing investors with an up-to-date perspective on the company’s performance and outlook.
Read full news article Announcements
Announcement under Regulation 30 (LODR)-Newspaper Publication
22-Jun-2026 | Source : BSEPlease find the attached.
Notice Of Extra-Ordinary General Meeting Of The Company (EGM) Scheduled To Be Held On Tuesday July 14 2026 At 03:30 P.M. (IST) Through Video Conferencing / Other Audio-Visual Means
20-Jun-2026 | Source : BSEPlease find the attached.
Board Meeting Intimation for Considering And Approving The Raising Of Funds
18-Jun-2026 | Source : BSEManappuram Finance Ltdhas informed BSE that the meeting of the Board of Directors of the Company is scheduled on 23/06/2026 inter alia to consider and approve the raising of funds including by way of issuance of listed Non-Convertible Debentures/Bonds and Commercial Papers as part of the proposed enhancement of the borrowing limits of the Company under Section 180(1)(c) of the Companies Act 2013 subject to the approval of the shareholders of the Company.
Corporate Actions

No Upcoming Board Meetings

Manappuram Finance Ltd has declared 25% dividend, ex-date: 11 May 26

Manappuram Finance Ltd has announced 2:10 stock split, ex-date: 03 May 10

Manappuram Finance Ltd has announced 1:1 bonus issue, ex-date: 09 Jun 11

No Rights history available
Quality key factors
Valuation key factors
Technicals key factors
 Technical Indicator Scale: Bearish, Mildly Bearish, Sideways, Mildly Bullish, Bullish Turned
 Shareholding Snapshot : Apr 2026
Shareholding Compare (%holding)
Promoters
None
Held by 33 Schemes (10.68%)
Held by 185 FIIs (23.42%)
Nandakumar V P (26.18%)
Smallcap World Fund, Inc (6.02%)
16.02%
Quarterly Results Snapshot (Consolidated) - Mar'26 - QoQ

QoQ Growth in quarter ended Mar 2026 is 11.03% vs 3.55% in Dec 2025
QoQ Growth in quarter ended Mar 2026 is 67.58% vs 9.63% in Dec 2025
Half Yearly Results Snapshot (Consolidated) - Sep'25

Growth in half year ended Sep 2025 is -11.24% vs 22.20% in Sep 2024
Growth in half year ended Sep 2025 is -68.16% vs 6.73% in Sep 2024
Nine Monthly Results Snapshot (Consolidated) - Dec'25
YoY Growth in nine months ended Dec 2025 is -10.17% vs 18.24% in Dec 2024
YoY Growth in nine months ended Dec 2025 is -57.41% vs -13.51% in Dec 2024
Annual Results Snapshot (Consolidated) - Mar'26
YoY Growth in year ended Mar 2026 is -5.01% vs 13.15% in Mar 2025
YoY Growth in year ended Mar 2026 is -17.50% vs -44.43% in Mar 2025
About Manappuram Finance Ltd

Company Coordinates


