
Compare Poonawalla Fin with Similar Stocks
Stock DNA
Non Banking Financial Company (NBFC)
INR 37,061 Cr (Mid Cap)
69.00
21
0.00%
4.68
5.24%
3.62
Total Returns (Price + Dividend) 
Latest dividend: 1.9927083333333333 per share ex-dividend date: Jan-31-2024
Risk Adjusted Returns v/s
Returns Beta

News

Poonawalla Fincorp Ltd Upgraded to Buy on Strong Fundamentals and Technical Improvement
Poonawalla Fincorp Ltd has been upgraded from a Hold to a Buy rating by MarketsMOJO as of 22 June 2026, reflecting a marked improvement across key investment parameters including quality, valuation, financial trends, and technical indicators. The company’s robust quarterly performance, sustained long-term growth, and evolving technical outlook underpin this positive revision despite some valuation concerns.
Read full news article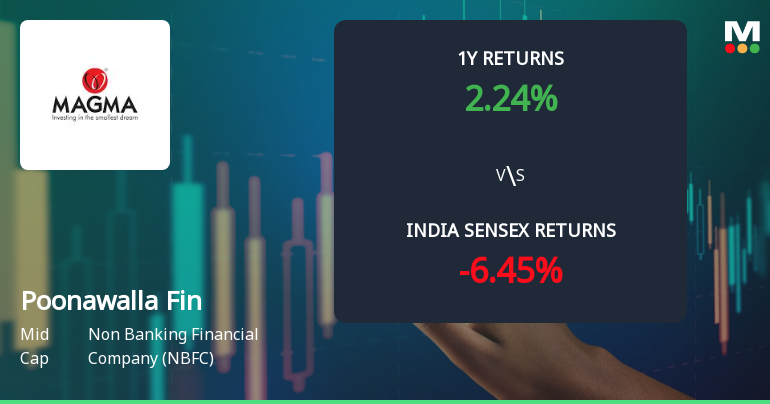
Poonawalla Fincorp Ltd Technical Momentum Shifts Signal Mildly Bullish Outlook
Poonawalla Fincorp Ltd, a mid-cap player in the Non Banking Financial Company (NBFC) sector, has recently exhibited a notable shift in its technical momentum, moving from a sideways trend to a mildly bullish stance. This transition is underscored by mixed signals from key technical indicators such as MACD, RSI, Bollinger Bands, and moving averages, reflecting a nuanced market sentiment as the stock trades near ₹425.
Read full news article
Poonawalla Fincorp Ltd Technical Momentum Shifts Amid Mixed Signals
Poonawalla Fincorp Ltd has exhibited a notable shift in its technical momentum, moving from a mildly bearish stance to a more sideways trend, reflecting a complex interplay of indicator signals. Despite a strong day change of 5.48%, the stock’s technical indicators present a mixed picture, with some suggesting bullish momentum while others remain cautious, signalling a period of consolidation for this mid-cap NBFC.
Read full news article Announcements
Announcement under Regulation 30 (LODR)-Analyst / Investor Meet - Intimation
19-Jun-2026 | Source : BSEIntimation w.r.t. Investors meet
Announcement under Regulation 30 (LODR)-Newspaper Publication
05-Jun-2026 | Source : BSEIntimation w.r.t Newspaper Publication
Announcement under Regulation 30 (LODR)-Newspaper Publication
02-Jun-2026 | Source : BSEIntimation w.r.t Newspaper Publication
Corporate Actions

No Upcoming Board Meetings

Poonawalla Fincorp Ltd has declared 100% dividend, ex-date: 31 Jan 24

Poonawalla Fincorp Ltd has announced 2:10 stock split, ex-date: 13 Aug 10

No Bonus history available

No Rights history available
Quality key factors
Valuation key factors
Technicals key factors
 Technical Indicator Scale: Bearish, Mildly Bearish, Sideways, Mildly Bullish, Bullish Turned
 Shareholding Snapshot : Apr 2026
Shareholding Compare (%holding)
Promoters
None
Held by 20 Schemes (10.64%)
Held by 169 FIIs (11.26%)
Rising Sun Holdings Pvt Ltd (59.03%)
Kotak Midcap Fund (6.4%)
8.91%
Quarterly Results Snapshot (Consolidated) - Mar'26 - QoQ

QoQ Growth in quarter ended Mar 2026 is 16.34% vs 17.90% in Dec 2025
QoQ Growth in quarter ended Mar 2026 is 69.61% vs 102.45% in Dec 2025
Half Yearly Results Snapshot (Consolidated) - Sep'25

Growth in half year ended Sep 2025 is 45.25% vs 37.38% in Sep 2024
Growth in half year ended Sep 2025 is 176.25% vs -116.52% in Sep 2024
Nine Monthly Results Snapshot (Consolidated) - Dec'25
YoY Growth in nine months ended Dec 2025 is 54.61% vs 37.81% in Dec 2024
YoY Growth in nine months ended Dec 2025 is 278.64% vs -111.89% in Dec 2024
Annual Results Snapshot (Consolidated) - Mar'26
YoY Growth in year ended Mar 2026 is 62.07% vs 34.76% in Mar 2025
YoY Growth in year ended Mar 2026 is 650.96% vs -105.84% in Mar 2025
About Poonawalla Fincorp Ltd

Company Coordinates


