
Compare Tanla Platforms with Similar Stocks
Dashboard
The company is Net-Debt Free
Poor long term growth as Net Sales has grown by an annual rate of 13.54% and Operating profit at 8.84% over the last 5 years
Positive results in Mar 26
With ROE of 20.5, it has a Fair valuation with a 2.8 Price to Book Value
Falling Participation by Institutional Investors
Consistent Underperformance against the benchmark over the last 3 years
Stock DNA
Software Products
INR 7,096 Cr (Small Cap)
14.00
19
2.26%
-0.42
20.46%
2.83
Total Returns (Price + Dividend) 
Latest dividend: 6 per share ex-dividend date: Apr-30-2026
Risk Adjusted Returns v/s
Returns Beta

News

Tanla Platforms Ltd Upgraded to Hold by MarketsMOJO Amid Mixed Financial and Technical Signals
Tanla Platforms Ltd has seen its investment rating upgraded from Sell to Hold as of 30 June 2026, reflecting a nuanced improvement across technical indicators, financial trends, valuation metrics, and overall quality. This shift comes amid a backdrop of mixed performance, with the company demonstrating positive quarterly results and stabilising technical signals despite longer-term challenges.
Read full news article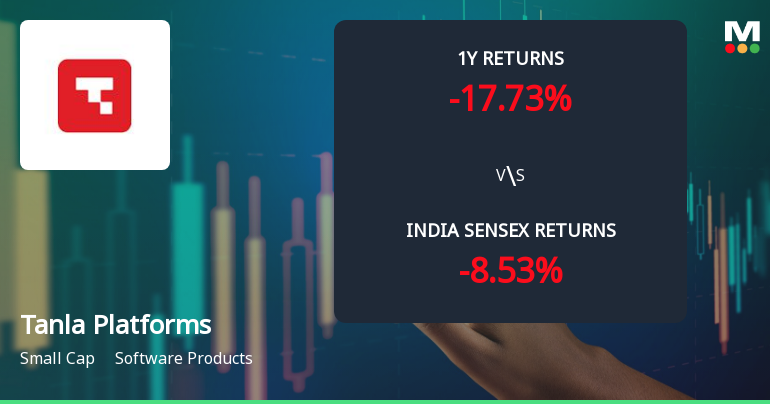
Tanla Platforms Ltd Technical Momentum Shifts Amid Mixed Market Signals
Tanla Platforms Ltd, a small-cap player in the Software Products sector, has experienced a notable shift in its technical momentum, moving from a mildly bearish stance to a sideways trend. This transition is underscored by a complex interplay of technical indicators, including MACD, RSI, moving averages, and Bollinger Bands, signalling a nuanced outlook for investors as the stock navigates recent market pressures.
Read full news article
Tanla Platforms Ltd is Rated Sell
Tanla Platforms Ltd is rated Sell by MarketsMOJO, with this rating last updated on 08 June 2026. However, the analysis and financial metrics discussed here reflect the stock’s current position as of 20 June 2026, providing investors with the latest insights into its performance and outlook.
Read full news article Announcements
Reg. 34 (1) Annual Report.
28-Jun-2026 | Source : BSEEnclosed
Announcement under Regulation 30 (LODR)-Newspaper Publication
28-Jun-2026 | Source : BSENewspaper advertisement for information regarding 30th Annual General Meeting of the Company
Announcement under Regulation 30 (LODR)-Newspaper Publication
28-Jun-2026 | Source : BSECopy of Newspaper Publication
Corporate Actions

No Upcoming Board Meetings

Tanla Platforms Ltd has declared 600% dividend, ex-date: 30 Apr 26

Tanla Platforms Ltd has announced 1:2 stock split, ex-date: 02 May 08

No Bonus history available

No Rights history available
Quality key factors
Valuation key factors
Technicals key factors
 Technical Indicator Scale: Bearish, Mildly Bearish, Sideways, Mildly Bullish, Bullish Turned
 Shareholding Snapshot : Mar 2026
Shareholding Compare (%holding)
Promoters
None
Held by 7 Schemes (0.16%)
Held by 135 FIIs (7.6%)
Dasari Uday Kumar Reddy (23.45%)
Ponguleti Harsha Reddy (2.61%)
37.4%
Quarterly Results Snapshot (Consolidated) - Mar'26 - YoY

YoY Growth in quarter ended Mar 2026 is 14.95% vs 1.87% in Mar 2025
YoY Growth in quarter ended Mar 2026 is 14.48% vs -9.91% in Mar 2025
Half Yearly Results Snapshot (Consolidated) - Sep'25
Growth in half year ended Sep 2025 is 5.80% vs 4.34% in Sep 2024

Growth in half year ended Sep 2025 is -10.31% vs -2.35% in Sep 2024
Nine Monthly Results Snapshot (Consolidated) - Dec'25
YoY Growth in nine months ended Dec 2025 is 7.88% vs 2.77% in Dec 2024
YoY Growth in nine months ended Dec 2025 is -3.88% vs -6.73% in Dec 2024
Annual Results Snapshot (Consolidated) - Mar'26
YoY Growth in year ended Mar 2026 is 9.68% vs 2.54% in Mar 2025
YoY Growth in year ended Mar 2026 is 0.37% vs -7.48% in Mar 2025
About Tanla Platforms Ltd

Company Coordinates


