

Key Events This Week
1 June: MarketsMOJO upgrades Tanla Platforms Ltd to Hold rating
2 June: Stock rallies 4.55% on upgrade and technical momentum shift
3 June: Profit-taking leads to 2.71% decline amid mixed market cues
5 June: Week closes at Rs.516.20, down 1.88% for the week

Tanla Platforms Ltd Downgraded to Sell Amid Mixed Financials and Weak Institutional Support
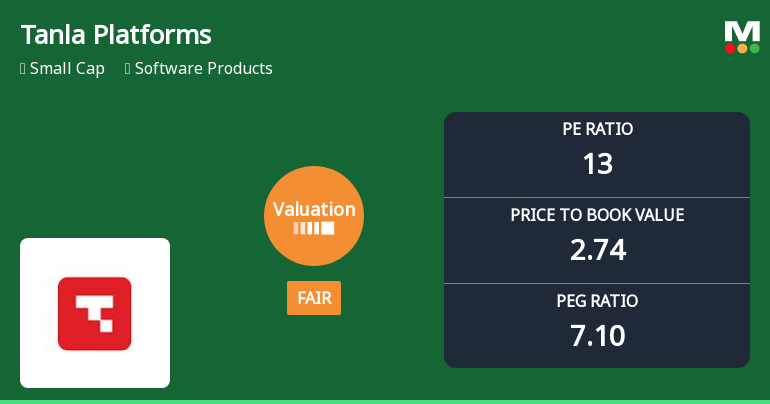
2026-06-09 08:36:47Tanla Platforms Ltd, a small-cap player in the Software Products sector, has seen its investment rating downgraded from Hold to Sell as of 8 June 2026. Despite posting record quarterly sales and profits in Q4 FY25-26, the company faces challenges including sluggish long-term growth, declining institutional participation, and consistent underperformance against benchmark indices, prompting a reassessment of its investment appeal.
Read full news article
Tanla Platforms Ltd Upgraded to Hold by MarketsMOJO Amid Mixed Financial and Technical Signals
2026-06-02 08:42:00Tanla Platforms Ltd has seen its investment rating upgraded from Sell to Hold as of 1 June 2026, reflecting a nuanced improvement across technical indicators, valuation metrics, financial trends, and overall quality. This reassessment by MarketsMOJO highlights a shift in market sentiment and company fundamentals, although challenges remain in long-term growth and institutional participation.
Read full news article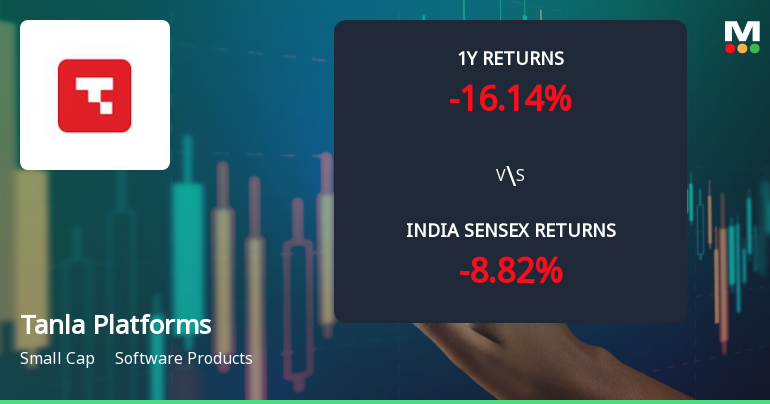
Tanla Platforms Ltd Technical Momentum Shifts Amid Mixed Market Signals
2026-06-02 08:02:45Tanla Platforms Ltd, a small-cap player in the Software Products sector, has experienced a notable shift in its technical momentum, moving from a mildly bearish stance to a sideways trend. Despite a modest day decline of 1.17%, the stock’s technical indicators present a complex picture, with some signals suggesting cautious optimism while others point to lingering bearish pressures.
Read full news article
Tanla Platforms Ltd is Rated Sell
2026-05-24 10:10:15Tanla Platforms Ltd is rated 'Sell' by MarketsMOJO, with this rating last updated on 12 May 2026. However, the analysis and financial metrics presented here reflect the stock's current position as of 24 May 2026, providing investors with an up-to-date view of the company’s fundamentals, returns, and market standing.
Read full news article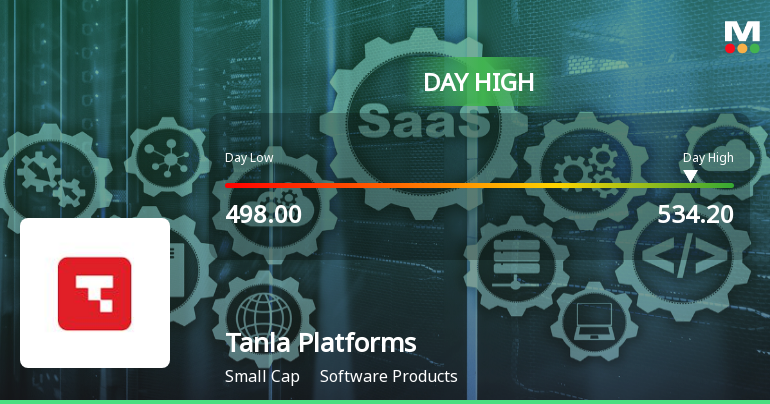
Tanla Platforms Ltd Surges 7.31% to Day's High of Rs 534.2 — Outperforms Sector by 3.66 Percentage Points
2026-05-19 11:16:02The Sensex advanced 0.4% on 19 May 2026, yet Tanla Platforms Ltd outpaced the broader market with a robust 7.31% gain, reaching an intraday high of Rs 534.2. This 3.66 percentage-point outperformance over the Software Products sector’s 3.53% rise signals a distinctly stock-specific rally rather than a mere market tailwind.
Read full news article


