Tanla Platforms

  • Market Cap: Small Cap
  • Industry: Software Products
  • ISIN: INE483C01032
  • NSEID: TANLA
  • BSEID: 532790
INR
614.20
4.95 (0.81%)
BSENSE

Aug 07, 03:30 PM

BSE+NSE Vol: 6.23 lacs

  • Price Points
  • Score
  • Mojo Parameters
  • Total Return
  • News and Corporate Actions
  • Key factors
  • Shareholding
  • Financials
  • CompanyCV
stock-summaryPrice Point
High/Low

1Day

52 Week

Valuation
Technical
Day's Volume

CASH

6.23 lacs (-23.55%) Volume

Shareholding (Jun 2026)

FII

7.63%

Held by 140 FIIs

DII

0.39%

Held by 1 DIIs

Promoter

46.17%

Why is Tanla Platforms Ltd falling/rising?

07-Aug-2026

As of 06-Aug, Tanla Platforms Ltd's stock price is 609.25, down 0.74%, but it has gained 15.78% year-to-date, outperforming the Sensex. The company is net-debt free with strong financial results, indicating a solid position despite a recent decline in investor participation.

As of 06-Aug, Tanla Platforms Ltd is experiencing a slight decline in its stock price, currently at 609.25, which reflects a change of -4.55 or -0.74%. Despite this decrease, the stock has shown positive performance over the past week and month, with returns of +2.65% and +11.82%, respectively. Year-to-date, the stock has increased by 15.78%, significantly outperforming the Sensex, which has declined by 7.35% during the same period.<BR><BR>The stock's current price is above its moving averages for 5, 20, 50, 100, and 200 days, indicating a generally strong trend. However, there has been a notable decrease in investor participation, with delivery volume falling by 11.66% compared to the 5-day average, which may contribute to the current price decline. <BR><BR>On a positive note, Tanla Platforms Ltd is net-debt free and has reported strong financial results over the last three quarters, including record net sales and profit before tax figures. The company has a return on equity (ROE) of 20.5 and a fair valuation with a price-to-book ratio of 3.2, suggesting that while the stock is trading at a premium compared to its peers, it remains fundamentally strong. Despite the recent price drop, the overall performance metrics indicate that the company is in a solid position, which may support future price stability or recovery.

View full answer

Are Tanla Platforms Ltd latest results good or bad?

23-Jul-2026

Tanla Platforms Ltd's latest Q1 FY27 results are generally positive, with a net profit of ₹142.17 crore and record net sales of ₹1,226.39 crore, reflecting strong growth. However, declining return on capital employed and return on equity raise concerns about capital efficiency that investors should monitor.

Tanla Platforms Ltd's latest results for Q1 FY27 can be considered good overall. The company reported a net profit of ₹142.17 crore, which reflects a 5.84% increase quarter-on-quarter and a significant 20.07% increase year-on-year. Additionally, net sales reached a record high of ₹1,226.39 crore, marking a 4.15% growth from the previous quarter and an impressive 17.85% growth compared to the same period last year.<BR><BR>The operating margin improved slightly to 16.40%, and the profit after tax (PAT) margin also saw a modest increase to 11.59%. These figures indicate that the company is effectively managing its costs while driving revenue growth.<BR><BR>However, there are some concerns regarding capital efficiency, as both return on capital employed (ROCE) and return on equity (ROE) have declined compared to historical averages. This suggests that while the company is growing its revenue, it may not be generating as much profit from its investments as it has in the past.<BR><BR>In summary, while Tanla Platforms has shown strong revenue and profit growth, the declining efficiency metrics warrant attention. Investors should keep an eye on these trends in future quarters to assess the sustainability of the company's growth.

View full answer

Should I buy, sell or hold Tanla Platforms Ltd?

23-Jul-2026

When is the next results date for Tanla Platforms Ltd?

15-Jul-2026

The next results date for Tanla Platforms Ltd is July 22, 2026.

The next results date for Tanla Platforms Ltd is scheduled for July 22, 2026.

View full answer

How big is Tanla Platforms?

11-Jun-2026

As of 10th June, Tanla Platforms Ltd has a market capitalization of 6,929.00 Cr, with recent net sales of 4,417.72 Cr and a net profit of 509.15 Cr. Shareholder's funds are 2,268.29 Cr, and total assets amount to 3,291.36 Cr.

As of 10th June, Tanla Platforms Ltd has a market capitalization of 6,929.00 Cr, categorizing it as a Small Cap company.<BR><BR>In the latest four quarters, Tanla Platforms reported Net Sales of 4,417.72 Cr and a Net Profit of 509.15 Cr.<BR><BR>The latest annual reporting period for the balance sheet is March 2025, with Shareholder's Funds amounting to 2,268.29 Cr and Total Assets of 3,291.36 Cr.

View full answer

Who are in the management team of Tanla Platforms?

11-Jun-2026

The management team of Tanla Platforms includes D Uday Kumar Reddy (Chairman), Sanjay Kapoor, Amrita Gangotra, Rohit Bhasin, Deepak Satyaprakash Goyal, Rahul Khanna, Sanja Baweja, and Seshanuradha Chava (Company Secretary). They are responsible for the company's strategic direction and governance.

The management team of Tanla Platforms includes the following key members:<BR><BR>1. **D Uday Kumar Reddy** - Chairman / Executive Director<BR>2. **Sanjay Kapoor** - Non-Executive & Non-Independent Director<BR>3. **Amrita Gangotra** - Independent Non-Executive Director<BR>4. **Rohit Bhasin** - Independent Non-Executive Director<BR>5. **Deepak Satyaprakash Goyal** - Executive Director<BR>6. **Rahul Khanna** - Independent Non-Executive Director<BR>7. **Sanja Baweja** - Independent Non-Executive Director<BR>8. **Seshanuradha Chava** - Company Secretary / General Counsel / Chief Risk Officer<BR><BR>This team is responsible for guiding the company's strategic direction and governance.

View full answer

Who are the peers of the Tanla Platforms?

11-Jun-2026

Tanla Platforms' peers include Oracle Fin.Serv., C.E. Info System, Moschip Tech., Technvision Ven., Ramco Systems, Nucleus Soft., Blue Cloud Soft., Unicommerce, and Quick Heal Tech. Management risk varies from excellent to below average, with Tanla Platforms showing average risk and a 1-year return of -17.56%.

Peers: The peers of Tanla Platforms are Oracle Fin.Serv., C.E. Info System, Moschip Tech., Technvision Ven., Ramco Systems, Nucleus Soft., Blue Cloud Soft., Unicommerce, and Quick Heal Tech.<BR><BR>Quality Snapshot: Excellent management risk is observed at Oracle Fin.Serv. and the rest. Good management risk is found at C.E. Info System and Nucleus Soft., while Average management risk is present at Tanla Platforms, Technvision Ven., Ramco Systems, Blue Cloud Soft., and Quick Heal Tech. Below Average management risk is noted at Moschip Tech. Growth is Excellent at Moschip Tech., Blue Cloud Soft., and Unicommerce, while Below Average growth is seen at Oracle Fin.Serv., Tanla Platforms, C.E. Info System, Technvision Ven., Ramco Systems, Nucleus Soft., and the rest. Capital Structure is Excellent at Oracle Fin.Serv., Tanla Platforms, C.E. Info System, Technvision Ven., and Nucleus Soft., while Good is noted at Moschip Tech. and Quick Heal Tech., and Below Average at Ramco Systems.<BR><BR>Return Snapshot: The peer with the highest 1-year return is Technvision Ven. at 36.48%, while the lowest is C.E. Info System at -56.54%. Tanla Platforms has a 1-year return of -17.56%, which is higher than C.E. Info System but lower than Technvision Ven. Additionally, several peers, including C.E. Info System, Technvision Ven., Nucleus Soft., Blue Cloud Soft., Unicommerce, and Quick Heal Tech, have negative six-month returns.

View full answer

What does Tanla Platforms do?

10-Jun-2026

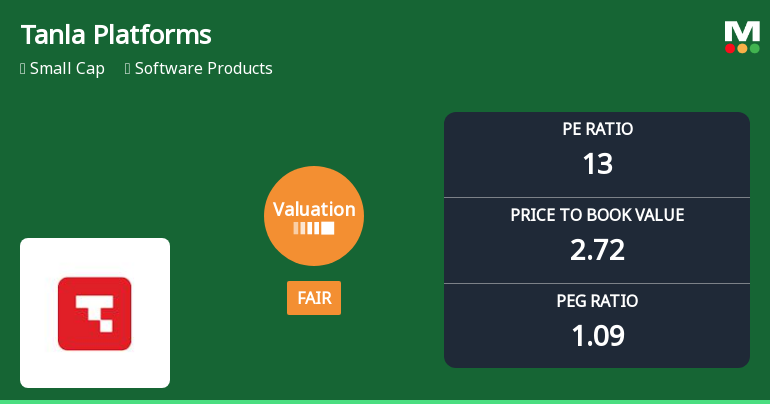
Tanla Platforms Ltd is a small-cap software solutions provider specializing in telecom infrastructure and services, with net sales of 1,178 Cr and a net profit of 134 Cr for the quarter ending March 2026. The company has a market cap of INR 6,929 Cr and key metrics include a P/E ratio of 13.00 and a dividend yield of 2.31%.

Overview:<BR>Tanla Platforms Ltd is an end-to-end solutions provider in the software products industry, operating within the small-cap market segment.<BR><BR>History:<BR>Tanla Platforms Ltd was incorporated in an unspecified year and has maintained its status as a provider of telecom infrastructure and services. The latest quarterly results reported net sales and profit for the period ending March 2026.<BR><BR>Financial Snapshot:<BR>- Net Sales: 1,178 Cr (Quarterly Results - Mar 2026)<BR>- Net Profit: 134 Cr (Quarterly Results - Mar 2026)<BR>- Market Cap: INR 6,929 Cr (Small Cap)<BR><BR>Key Metrics:<BR>- P/E: 13.00<BR>- Industry P/E: 20<BR>- Dividend Yield: 2.31%<BR>- Debt Equity: -0.42<BR>- Return on Equity: 20.46%<BR>- Price to Book: 2.76<BR><BR>Contact Details:<BR>- Address: Tanla Technology Centre, Hitech City Road Madhapur Hyderabad Telangana : 500081<BR>- Tel: 91-40-40099999<BR>- Email: investorhelp@tanla.com<BR>- Website: http://www.tanlasolutions.com

View full answer

Is Tanla Platforms overvalued or undervalued?

02-Dec-2025

As of December 1, 2025, Tanla Platforms is fairly valued with a PE ratio of 15.43 and an attractive valuation grade, but it has underperformed the Sensex with a year-to-date return of -17.00%, raising concerns about its growth prospects compared to peers like TCS and Infosys.

As of 1 December 2025, the valuation grade for Tanla Platforms has moved from very attractive to attractive, indicating a shift in its perceived value. The company is currently fairly valued, with a PE ratio of 15.43, an EV to EBITDA of 9.89, and a dividend yield of 3.26%. In comparison, its peers such as TCS and Infosys have higher PE ratios of 22.56 and 23.09, respectively, suggesting that Tanla Platforms may be undervalued relative to these industry leaders.<BR><BR>Despite the attractive valuation metrics, Tanla Platforms has underperformed against the Sensex over various time frames, with a year-to-date return of -17.00% compared to the Sensex's 9.60%. This underperformance, coupled with a high ROCE of 38.01% and ROE of 21.19%, indicates that while the stock is fairly valued, there may be concerns regarding its growth prospects compared to its peers.

View full answer

Is Tanla Platforms technically bullish or bearish?

02-Dec-2025

As of December 1, 2025, the trend is mildly bullish based on monthly MACD and daily moving averages, but mixed signals from weekly MACD and Bollinger Bands suggest a cautious outlook.

As of 1 December 2025, the technical trend has changed from mildly bearish to mildly bullish. The current stance is mildly bullish, supported by a mildly bullish signal from the monthly MACD and daily moving averages. However, the weekly MACD and Bollinger Bands indicate bearish tendencies, suggesting mixed signals in the short term. The RSI shows no signal on both weekly and monthly time frames, and there are no discernible trends in Dow Theory or OBV. Overall, while there are bullish indicators, the presence of bearish signals in other areas indicates a cautious outlook.

View full answer

How has been the historical performance of Tanla Platforms?

01-Dec-2025

Tanla Platforms has shown consistent growth in net sales, increasing from 1,003.96 Cr in Mar'19 to 4,027.72 Cr in Mar'25, but profit margins have fluctuated, with profit after tax declining from 548.32 Cr in Mar'24 to 507.28 Cr in Mar'25. The company has a strong asset base, with total assets rising to 3,291.36 Cr in Mar'25, while cash flow from operating activities improved to 642.00 Cr.

Answer:<BR>The historical performance of Tanla Platforms shows a consistent growth trajectory in net sales and profits over the years, with some fluctuations in profit margins.<BR><BR>Breakdown:<BR>Tanla Platforms has demonstrated significant growth in net sales, increasing from 1,003.96 Cr in Mar'19 to 4,027.72 Cr in Mar'25. The total operating income followed a similar trend, reaching 4,027.72 Cr in Mar'25, up from 3,354.55 Cr in Mar'23. The company's operating profit (PBDIT) peaked at 774.88 Cr in Mar'24 but slightly declined to 731.05 Cr in Mar'25. Profit before tax also showed fluctuations, with a high of 683.40 Cr in Mar'24 and a decrease to 627.31 Cr in Mar'25. Profit after tax reached 507.28 Cr in Mar'25, down from 548.32 Cr in Mar'24. The earnings per share (EPS) were 37.69 in Mar'25, a decrease from 40.77 in Mar'24. The operating profit margin (excluding other income) was 17.15% in Mar'25, down from 18.64% in Mar'24, while the profit after tax margin was 12.59% in Mar'25, compared to 13.96% in Mar'24. The total assets of the company increased from 1,132.20 Cr in Mar'20 to 3,291.36 Cr in Mar'25, reflecting a strong asset base. Total liabilities also rose, reaching 3,291.36 Cr in Mar'25, with no long-term borrowings reported. The cash flow from operating activities improved to 642.00 Cr in Mar'25, indicating a positive cash generation capability. Overall, while Tanla Platforms has shown robust growth in sales and assets, profit margins have experienced some volatility in recent years.

View full answer

Who are the top shareholders of the Tanla Platforms?

17-Jul-2025

The top shareholders of Tanla Platforms include promoter Dasari Uday Kumar Reddy with 21.72%, 144 Foreign Institutional Investors holding 10.4%, and individual investors collectively owning 36.81%, while Smallcap World Fund, Inc. holds 2.73% and mutual funds account for 0.75%. Overall, the majority of shares are held by non-institutional investors.

The top shareholders of Tanla Platforms include Dasari Uday Kumar Reddy, who is the promoter with the highest holding at 21.72%. Additionally, institutional investors play a role, with 144 Foreign Institutional Investors (FIIs) holding 10.4% of the shares. Among public shareholders, Smallcap World Fund, Inc. holds 2.73%. Individual investors collectively account for 36.81% of the shareholding. There are also 15 mutual fund schemes that hold a combined 0.75%. Overall, the majority of the shareholding is held by non-institutional investors.

View full answer

Has Tanla Platforms declared dividend?

06-Jun-2025

Tanla Platforms Ltd has declared a 600% dividend, amounting to ₹6 per share, with an ex-date of April 30, 2025. While the dividend yield is 2.86%, total returns over shorter periods have been negative, contrasting with a substantial 817.45% total return over the past five years.

Tanla Platforms Ltd has declared a 600% dividend.<BR><BR>Dividend Details:<BR>- Percentage announced: 600%<BR>- Amount per share: 6 per share<BR>- Ex-date: 30 Apr 25<BR><BR>Dividend Yield: 2.86%.<BR><BR>Total Returns by Period:<BR>Over the last 6 months, the price return was -14.36%, the dividend return was 1.63%, resulting in a total return of -12.73%.<BR><BR>In the past year, the price return was -30.52%, the dividend return was 1.95%, leading to a total return of -28.57%.<BR><BR>For the 2-year period, the price return was -22.56%, the dividend return was 2.72%, which resulted in a total return of -19.84%.<BR><BR>Over the last 3 years, the price return was -54.07%, the dividend return was 3.52%, culminating in a total return of -50.55%.<BR><BR>In the 4-year period, the price return was -30.0%, the dividend return was 4.37%, resulting in a total return of -25.63%.<BR><BR>Finally, over the past 5 years, the price return was 767.45%, the dividend return was 50.00%, leading to a total return of 817.45%.<BR><BR>Overall, while Tanla Platforms has declared a significant dividend, the total returns over various periods show a mixed performance, particularly with negative returns in shorter time frames, contrasting sharply with the exceptional return over the 5-year period.

View full answer
iScoreScore
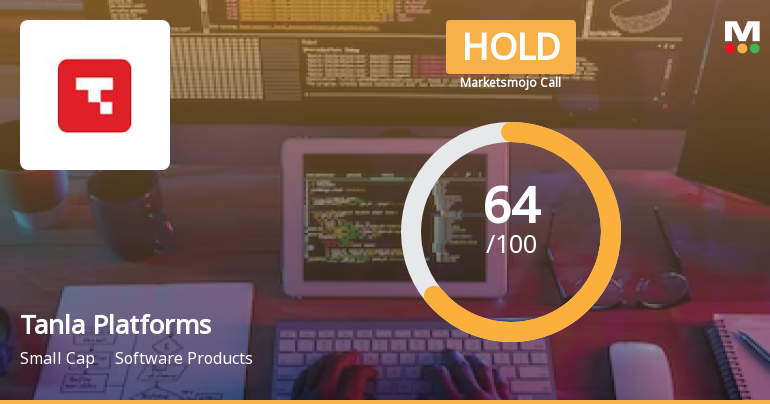
Click here to find our call on this stock
Strong Sell
Sell
Hold
Buy
Strong Buy

Dashboard

1

The company is Net-Debt Free

 
2

Poor long term growth as Net Sales has grown by an annual rate of 12.88% and Operating profit at 6.79% over the last 5 years

 
3

The company has declared Positive results for the last 3 consecutive quarters

4

With ROE of 20.5, it has a Fair valuation with a 3.3 Price to Book Value

5

Despite the size of the company, domestic mutual funds hold only 0.71% of the company

6

Consistent Underperformance against the benchmark over the last 3 years

stock-summaryMojo Parameters

Mojo Parameters

Loading Valuation Snapshot...

Stock DNA

stock-summary
Industry

Software Products

stock-summary
Market cap

INR 8,225 Cr (Small Cap)

stock-summary
P/E

15.00

stock-summary
Industry P/E

21

stock-summary
Dividend Yield

1.97%

stock-summary
Debt Equity

-0.42

stock-summary
Return on Equity

20.46%

stock-summary
Price to Book

3.24

Revenue and Profits:
Net Sales:
1,226 Cr
(Quarterly Results - Jun 2026)
Net Profit:
142 Cr
stock-summaryTotal Returns
Total Returns (Price + Dividend) stock-summary
Dividend Yield (1.97%)
TimePeriod
Price Return
Dividend Return
Total Return
3 Months
6.98%
0%
6.98%
6 Months
29.07%
1.20%
30.27%
1 Year
-4.36%
1.96%
-2.4%
2 Years
-34.44%
2.59%
-31.85%
3 Years
-45.68%
3.87%
-41.81%
4 Years
-18.16%
5.58%
-12.58%
5 Years
-33.44%
5.18%
-28.26%

Latest dividend: 6 per share ex-dividend date: Apr-30-2026

Risk Adjusted Returns v/s stock-summary
Returns Beta
Icon
Beta has not been calculated since enough price history is not available
stock-summaryNews & Corporate Actions

News

Announcements stock-summary

Board Meeting Outcome for Outcome Of The Board Meeting Held On July 28 2026

28-Jul-2026 | Source : BSE

Update on Acquisition

Announcement under Regulation 30 (LODR)-Updates on Acquisition

28-Jul-2026 | Source : BSE

Intimation under Regulation 30 (Read with Schedule III-Part A) of the Securities and Exchange Board of India (Listing Obligation and Disclosure Requirements) Regulations 2015

Announcement under Regulation 30 (LODR)-Newspaper Publication

23-Jul-2026 | Source : BSE

Newspaper Publication of Unaudited Results for quarter ended June 30 2026.

Corporate Actions stock-summary

stock-summary
BOARD MEETING

No Upcoming Board Meetings

stock-summary
DIVIDEND

Tanla Platforms Ltd has declared 600% dividend, ex-date: 30 Apr 26

stock-summary
SPLITS

Tanla Platforms Ltd has announced 1:2 stock split, ex-date: 02 May 08

stock-summary
BONUS

No Bonus history available

stock-summary
RIGHTS

No Rights history available

stock-summaryKey Factors

Quality key factors stock-summary

Factor
Value
Sales Growth (5y)
12.88%
EBIT Growth (5y)
6.79%
EBIT to Interest (avg)
100.00
Debt to EBITDA (avg)
Net Debt is too low
Net Debt to Equity (avg)
-0.42
Sales to Capital Employed (avg)
2.02
Tax Ratio
20.25%
Dividend Payout Ratio
31.84%
Pledged Shares
0
Institutional Holding
8.02%
ROCE (avg)
76.38%
ROE (avg)
28.08%

Valuation key factors

Factor
Value
P/E Ratio
15
Industry P/E
21
Price to Book Value
3.27
EV to EBIT
11.23
EV to EBITDA
9.34
EV to Capital Employed
4.90
EV to Sales
1.54
PEG Ratio
1.31
Dividend Yield
1.95%
ROCE (Latest)
41.44%
ROE (Latest)
20.46%

Technicals key factors

Indicator
Weekly
Monthly
MACD
Bullish
Mildly Bullish
RSI
No Signal
No Signal
Bollinger Bands
Bullish
Bullish
Moving Averages
Bullish (Daily)
KST
Bullish
Mildly Bullish
Dow Theory
Mildly Bearish
No Trend
OBV
No Trend
No Trend
stock-summary Technical Indicator Scale: Bearish, Mildly Bearish, Sideways, Mildly Bullish, Bullish  Turned 
stock-summaryShareholding
Shareholding Snapshot : Jun 2026stock-summary
Shareholding Compare (%holding) stock-summary
Majority shareholders

Promoters

Pledged Promoter Holdings

None

Mutual Funds

Held by 6 Schemes (0.38%)

FIIs

Held by 140 FIIs (7.63%)

Promoter with highest holding

Dasari Uday Kumar Reddy (23.45%)

Highest Public shareholder

Harsha Reddy Ponguleti (2.61%)

Individual Investors Holdings

37.02%

stock-summaryFinancial
[
  {
    "link": "quarterly",
    "btn_text": "All Quarterly Results",
    "header": "Quarterly Results Snapshot (Consolidated) - Jun'26 - YoY",
    "rhs": [
      {
        "prefix": "Net Sales ",
        "suffix": "YoY Growth in quarter ended Jun 2026 is 17.85% vs 3.84% in Jun 2025",
        "dir": 1
      },
      {
        "prefix": "Consolidated Net Profit ",
        "suffix": "YoY Growth in quarter ended Jun 2026 is 20.07% vs -16.15% in Jun 2025",
        "dir": 1
      }
    ],
    "table": {
      "header": [
        "Jun'26",
        "Jun'25",
        "Change(%)"
      ],
      "body": [
        {
          "field": "Net Sales",
          "val1": "1,226.39",
          "val2": "1,040.66",
          "chgp": "17.85%",
          "chgp_class": "positive"
        },
        {
          "field": "Operating Profit (PBDIT) excl Other Income",
          "val1": "201.15",
          "val2": "163.93",
          "chgp": "22.70%",
          "chgp_class": "positive"
        },
        {
          "field": "Interest",
          "val1": "1.08",
          "val2": "1.34",
          "chgp": "-19.40%",
          "chgp_class": "positive"
        },
        {
          "field": "Exceptional Items",
          "val1": "0.00",
          "val2": "0.00",
          "chgp": "",
          "chgp_class": "neutral"
        },
        {
          "field": "Consolidate Net Profit",
          "val1": "142.17",
          "val2": "118.41",
          "chgp": "20.07%",
          "chgp_class": "positive"
        },
        {
          "field": "Operating Profit Margin (Excl OI)",
          "val1": "16.40%",
          "val2": "15.75%",
          "chgp": "0.65%",
          "chgp_class": "positive"
        }
      ]
    }
  },
  {
    "link": "half-yearly",
    "btn_text": "All Half Yearly Results",
    "header": "Half Yearly Results Snapshot (Consolidated) - Sep'25",
    "rhs": [
      {
        "prefix": "Net Sales ",
        "suffix": " Growth in half year ended Sep 2025 is 5.80% vs 4.34% in Sep 2024",
        "dir": 1
      },
      {
        "prefix": "Consolidated Net Profit ",
        "suffix": " Growth in half year ended Sep 2025 is -10.31% vs -2.35% in Sep 2024",
        "dir": -1
      }
    ],
    "table": {
      "header": [
        "Sep'25",
        "Sep'24",
        "Change(%)"
      ],
      "body": [
        {
          "field": "Net Sales",
          "val1": "2,119.13",
          "val2": "2,002.93",
          "chgp": "5.80%",
          "chgp_class": "positive"
        },
        {
          "field": "Operating Profit (PBDIT) excl Other Income",
          "val1": "341.40",
          "val2": "363.97",
          "chgp": "-6.20%",
          "chgp_class": "negative"
        },
        {
          "field": "Interest",
          "val1": "2.57",
          "val2": "3.07",
          "chgp": "-16.29%",
          "chgp_class": "positive"
        },
        {
          "field": "Exceptional Items",
          "val1": "0.00",
          "val2": "0.00",
          "chgp": "",
          "chgp_class": "neutral"
        },
        {
          "field": "Consolidate Net Profit",
          "val1": "243.45",
          "val2": "271.43",
          "chgp": "-10.31%",
          "chgp_class": "negative"
        },
        {
          "field": "Operating Profit Margin (Excl OI)",
          "val1": "16.11%",
          "val2": "18.17%",
          "chgp": "-2.06%",
          "chgp_class": "negative"
        }
      ]
    }
  },
  {
    "link": "nine-monthly",
    "btn_text": "All Nine Monthly Results",
    "header": "Nine Monthly Results Snapshot (Consolidated) - Dec'25",
    "rhs": [
      {
        "prefix": "Net Sales ",
        "suffix": "YoY Growth in nine months ended Dec 2025 is 7.88% vs 2.77% in Dec 2024",
        "dir": 1
      },
      {
        "prefix": "Consolidated Net Profit ",
        "suffix": "YoY Growth in nine months ended Dec 2025 is -3.88% vs -6.73% in Dec 2024",
        "dir": 1
      }
    ],
    "table": {
      "header": [
        "Dec'25",
        "Dec'24",
        "Change(%)"
      ],
      "body": [
        {
          "field": "Net Sales",
          "val1": "3,240.17",
          "val2": "3,003.36",
          "chgp": "7.88%",
          "chgp_class": "positive"
        },
        {
          "field": "Operating Profit (PBDIT) excl Other Income",
          "val1": "531.94",
          "val2": "527.38",
          "chgp": "0.86%",
          "chgp_class": "positive"
        },
        {
          "field": "Interest",
          "val1": "3.76",
          "val2": "4.54",
          "chgp": "-17.18%",
          "chgp_class": "positive"
        },
        {
          "field": "Exceptional Items",
          "val1": "0.00",
          "val2": "0.00",
          "chgp": "",
          "chgp_class": "neutral"
        },
        {
          "field": "Consolidate Net Profit",
          "val1": "374.82",
          "val2": "389.94",
          "chgp": "-3.88%",
          "chgp_class": "negative"
        },
        {
          "field": "Operating Profit Margin (Excl OI)",
          "val1": "16.42%",
          "val2": "17.56%",
          "chgp": "-1.14%",
          "chgp_class": "negative"
        }
      ]
    }
  },
  {
    "link": "annual",
    "btn_text": "All Annual Results",
    "header": "Annual Results Snapshot (Consolidated) - Mar'26",
    "rhs": [
      {
        "prefix": "Net Sales ",
        "suffix": "YoY Growth in year ended Mar 2026 is 9.68% vs 2.54% in Mar 2025",
        "dir": 1
      },
      {
        "prefix": "Consolidated Net Profit ",
        "suffix": "YoY Growth in year ended Mar 2026 is 0.37% vs -7.48% in Mar 2025",
        "dir": 1
      }
    ],
    "table": {
      "header": [
        "Mar'26",
        "Mar'25",
        "Change(%)"
      ],
      "body": [
        {
          "field": "Net Sales",
          "val1": "4,417.71",
          "val2": "4,027.72",
          "chgp": "9.68%",
          "chgp_class": "positive"
        },
        {
          "field": "Operating Profit (PBDIT) excl Other Income",
          "val1": "723.76",
          "val2": "690.83",
          "chgp": "4.77%",
          "chgp_class": "positive"
        },
        {
          "field": "Interest",
          "val1": "4.39",
          "val2": "5.98",
          "chgp": "-26.59%",
          "chgp_class": "positive"
        },
        {
          "field": "Exceptional Items",
          "val1": "0.00",
          "val2": "0.00",
          "chgp": "",
          "chgp_class": "neutral"
        },
        {
          "field": "Consolidate Net Profit",
          "val1": "509.15",
          "val2": "507.28",
          "chgp": "0.37%",
          "chgp_class": "positive"
        },
        {
          "field": "Operating Profit Margin (Excl OI)",
          "val1": "16.38%",
          "val2": "17.15%",
          "chgp": "-0.77%",
          "chgp_class": "negative"
        }
      ]
    }
  }
]

Quarterly Results Snapshot (Consolidated) - Jun'26 - YoYstock-summary

Jun'26
Jun'25
Change(%)
Net Sales
1,226.39
1,040.66
17.85%
Operating Profit (PBDIT) excl Other Income
201.15
163.93
22.70%
Interest
1.08
1.34
-19.40%
Exceptional Items
0.00
0.00
Consolidate Net Profit
142.17
118.41
20.07%
Operating Profit Margin (Excl OI)
16.40%
15.75%
0.65%
Values in Rs Cr.
Direction Arrows
Net Sales

YoY Growth in quarter ended Jun 2026 is 17.85% vs 3.84% in Jun 2025

Direction Arrows
Consolidated Net Profit

YoY Growth in quarter ended Jun 2026 is 20.07% vs -16.15% in Jun 2025

Half Yearly Results Snapshot (Consolidated) - Sep'25stock-summary

Sep'25
Sep'24
Change(%)
Net Sales
2,119.13
2,002.93
5.80%
Operating Profit (PBDIT) excl Other Income
341.40
363.97
-6.20%
Interest
2.57
3.07
-16.29%
Exceptional Items
0.00
0.00
Consolidate Net Profit
243.45
271.43
-10.31%
Operating Profit Margin (Excl OI)
16.11%
18.17%
-2.06%
Values in Rs Cr.
Direction Arrows
Net Sales

Growth in half year ended Sep 2025 is 5.80% vs 4.34% in Sep 2024

Direction Arrows
Consolidated Net Profit

Growth in half year ended Sep 2025 is -10.31% vs -2.35% in Sep 2024

Nine Monthly Results Snapshot (Consolidated) - Dec'25stock-summary

Dec'25
Dec'24
Change(%)
Net Sales
3,240.17
3,003.36
7.88%
Operating Profit (PBDIT) excl Other Income
531.94
527.38
0.86%
Interest
3.76
4.54
-17.18%
Exceptional Items
0.00
0.00
Consolidate Net Profit
374.82
389.94
-3.88%
Operating Profit Margin (Excl OI)
16.42%
17.56%
-1.14%
Values in Rs Cr.
Direction Arrows
Net Sales

YoY Growth in nine months ended Dec 2025 is 7.88% vs 2.77% in Dec 2024

Direction Arrows
Consolidated Net Profit

YoY Growth in nine months ended Dec 2025 is -3.88% vs -6.73% in Dec 2024

Annual Results Snapshot (Consolidated) - Mar'26stock-summary

Mar'26
Mar'25
Change(%)
Net Sales
4,417.71
4,027.72
9.68%
Operating Profit (PBDIT) excl Other Income
723.76
690.83
4.77%
Interest
4.39
5.98
-26.59%
Exceptional Items
0.00
0.00
Consolidate Net Profit
509.15
507.28
0.37%
Operating Profit Margin (Excl OI)
16.38%
17.15%
-0.77%
Values in Rs Cr.
Direction Arrows
Net Sales

YoY Growth in year ended Mar 2026 is 9.68% vs 2.54% in Mar 2025

Direction Arrows
Consolidated Net Profit

YoY Growth in year ended Mar 2026 is 0.37% vs -7.48% in Mar 2025

stock-summaryCompany CV
About Tanla Platforms Ltd stock-summary
stock-summary
Tanla Platforms Ltd
Small Cap
Software Products
Tanla Platforms Limited (TPL), an end-to-end solutions provider, catering to customers worldwide in the telecom infrastructure, telecom services, offshore software development and maintenance sectors. Headquartered in Hyderabad, India, Company is at the forefront of creating technology-driven platforms designed to revolutionize trusted digital experiences, empowering consumers and enabling companies.
Company Coordinates stock-summary
Company Details
Tanla Technology Centre, Hitech City Road Madhapur Hyderabad Telangana : 500081
stock-summary
Tel: 91-40-40099999
stock-summary
investorhelp@tanla.com
Registrar Details
Karvy Computershare Pvt Ltd., Karvy Selenium, Tower-B Plot No 31 & 32, Survey No 116/22, 115/24, 115/25, Financial District, Nanakramguda, Serilingampally, Mandal Ranga Reddy Dist, Hyderabad