
Compare Genesys Intl. with Similar Stocks
Stock DNA
Computers - Software & Consulting
INR 1,453 Cr (Small Cap)
39.00
20
0.00%
0.10
4.99%
2.11
Total Returns (Price + Dividend) 
Latest dividend: 0.09999999999999999 per share ex-dividend date: Sep-18-2019
Risk Adjusted Returns v/s
Returns Beta

News
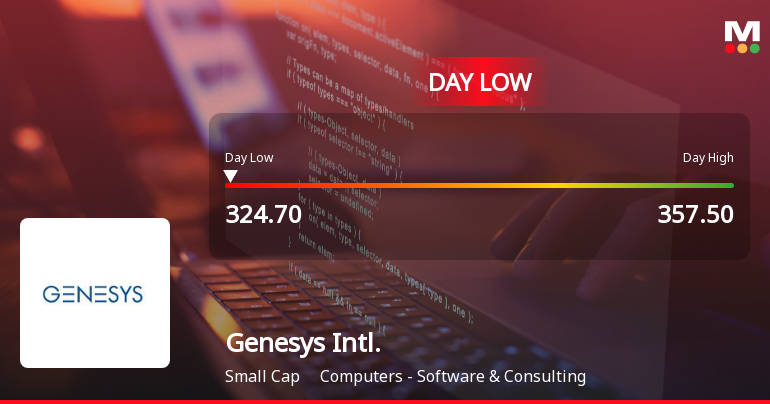
Genesys International Corporation Ltd Hits Intraday Low Amid Price Pressure
Shares of Genesys International Corporation Ltd experienced significant intraday weakness on 25 Jun 2026, touching a low of Rs 324.9, down 8.39% from the previous close. The stock underperformed its sector and broader market indices, reflecting immediate selling pressure and heightened volatility.
Read full news article
Genesys International Corporation Ltd Downgraded to Strong Sell Amid Valuation and Financial Concerns
Genesys International Corporation Ltd has been downgraded from a Sell to a Strong Sell rating by MarketsMOJO as of 23 June 2026, reflecting deteriorating fundamentals and stretched valuation metrics. The downgrade is driven by a combination of expensive valuation, weakening financial trends, subpar quality scores, and unfavourable technical indicators, signalling caution for investors in this small-cap software and consulting firm.
Read full news article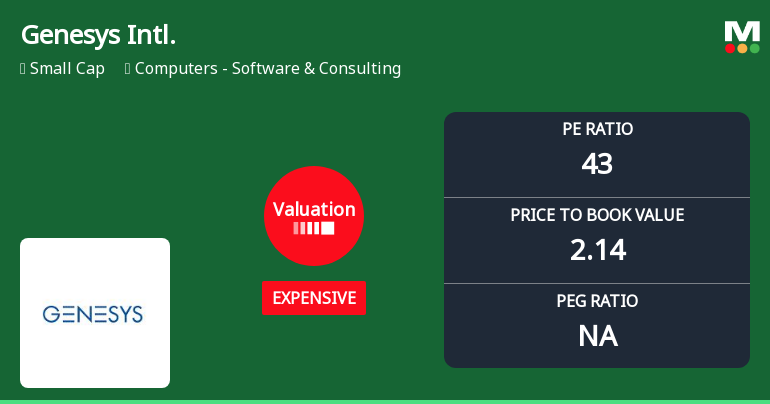
Genesys International Corporation Ltd Valuation Shifts Signal Price Attractiveness Concerns
Genesys International Corporation Ltd, a small-cap player in the Computers - Software & Consulting sector, has seen its valuation metrics shift notably towards the expensive territory, prompting a downgrade in its Mojo Grade to Strong Sell. This article analyses the recent changes in key valuation parameters, compares them with peer averages and historical benchmarks, and assesses the implications for investors.
Read full news article Announcements
Board Meeting Intimation for To Consider And Evaluate The Proposal For Raising Funds Through Issuance Of Securities
23-Jun-2026 | Source : BSEGenesys International Corporation Ltdhas informed BSE that the meeting of the Board of Directors of the Company is scheduled on 26/06/2026 inter alia to consider and approve Pursuant to Regulation 29 of the Securities and Exchange Board of India (Listing Obligations and Disclosure Requirements) Regulations 2015 (SEBI Listing Regulations) we wish to inform the Exchange that the meeting of the Board of Directors of Genesys International Corporation Limited (the Company) is scheduled to be held on Friday June 26 2026 inter alia to consider and evaluate the proposal for raising funds through issuance of securities as may be permitted under the applicable law. Further pursuant to the Insider Trading Code of Conduct of Genesys International Corporation Limited for Prevention of Insider Trading and Securities and Exchange Board of India (Prohibition of Insider Trading) Regulations 2015 (SEBI PIT Regulations) the Trading Window of the Company for dealing in securities by Designated Persons and their relatives will be closed on and from June 23 2026 till 48 hours from the conclusion of the Board Meeting
Disclosures under Reg. 29(2) of SEBI (SAST) Regulations 2011
17-Jun-2026 | Source : BSEThe Exchange has received the disclosure under Regulation 29(2) of SEBI (Substantial Acquisition of Shares & Takeovers) Regulations 2011 for Sajid Siraj Malik & PACs
Disclosures under Reg. 10(6) of SEBI (SAST) Regulations 2011
17-Jun-2026 | Source : BSEThe Exchange has received the disclosure under Regulation 10(6) of SEBI (Substantial Acquisition of Shares & Takeovers) Regulations 2011 for Sajid Siraj Malik
Corporate Actions

26 Jun 2026

Genesys International Corporation Ltd has declared 2% dividend, ex-date: 18 Sep 19

Genesys International Corporation Ltd has announced 5:10 stock split, ex-date: 23 Jun 10

No Bonus history available

No Rights history available
Quality key factors
Valuation key factors
Technicals key factors
 Technical Indicator Scale: Bearish, Mildly Bearish, Sideways, Mildly Bullish, Bullish Turned
 Shareholding Snapshot : Mar 2026
Shareholding Compare (%holding)
Non Institution
9.0085
Held by 0 Schemes
Held by 24 FIIs (2.34%)
Kilam Holdings Ltd (15.29%)
Sunita O Hemrajani (5.17%)
46.74%
Quarterly Results Snapshot (Consolidated) - Mar'26 - QoQ

QoQ Growth in quarter ended Mar 2026 is 37.53% vs -1.52% in Dec 2025
QoQ Growth in quarter ended Mar 2026 is 1,033.94% vs -90.92% in Dec 2025
Half Yearly Results Snapshot (Consolidated) - Sep'25

Growth in half year ended Sep 2025 is 15.68% vs 88.63% in Sep 2024
Growth in half year ended Sep 2025 is 15.11% vs 292.47% in Sep 2024
Nine Monthly Results Snapshot (Consolidated) - Dec'25
YoY Growth in nine months ended Dec 2025 is 3.10% vs 70.66% in Dec 2024
YoY Growth in nine months ended Dec 2025 is -45.77% vs 415.49% in Dec 2024
Annual Results Snapshot (Consolidated) - Mar'26
YoY Growth in year ended Mar 2026 is 5.39% vs 56.90% in Mar 2025
YoY Growth in year ended Mar 2026 is -42.05% vs 154.73% in Mar 2025
About Genesys International Corporation Ltd

Company Coordinates


