
Compare Ivalue Infosolut with Similar Stocks
Dashboard
High Management Efficiency with a high ROE of 0%
The company is Net-Debt Free
Poor long term growth as Net Sales has grown by an annual rate of 0% and Operating profit at 0% over the last 5 years
With ROE of 18, it has a Attractive valuation with a 2.6 Price to Book Value
Increasing Participation by Institutional Investors
Stock DNA
Computers - Software & Consulting
INR 1,488 Cr (Micro Cap)
14.00
21
0.00%
-0.12
19.28%
3.10
Total Returns (Price + Dividend) 
Ivalue Infosolut for the last several years.
Risk Adjusted Returns v/s
Returns Beta

News
Are Ivalue Infosolutions Ltd latest results good or bad?
Ivalue Infosolutions Ltd's latest financial results for Q1 FY27 indicate significant operational challenges. The company reported a net profit of ₹15.82 crore, which reflects a substantial decline of 62.79% compared to the previous quarter. Revenue also saw a notable contraction, falling to ₹179.73 crore, a decrease of 34.07% from Q4 FY26. This revenue figure marks the lowest quarterly performance in the trailing twelve months and represents a year-on-year decline of 21.14%, suggesting broader operational difficulties beyond typical seasonal fluctuations. The operating margin experienced a significant compression, dropping to 9.69% from 18.82% in the prior quarter, while the PAT margin also decreased to 8.75% from 15.65%. This deterioration in margins indicates challenges in managing costs amidst declining revenues. The company's reliance on other income, which contributed ₹6.62 crore during the quarter, p...
Read full news article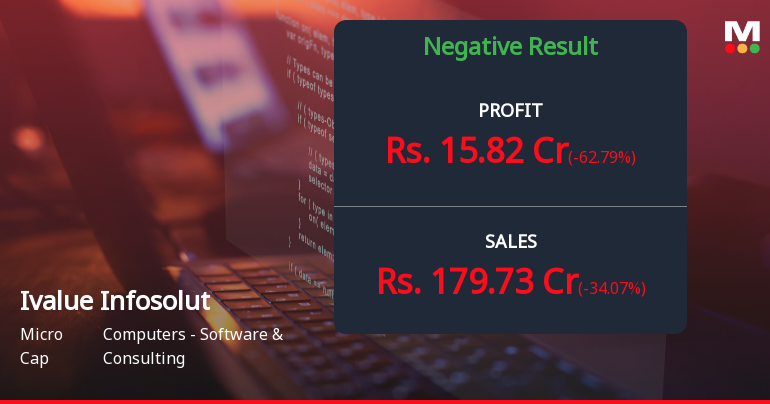
Ivalue Infosolutions Q1 FY27: Sharp Profit Drop Amid Revenue Contraction Raises Concerns
Ivalue Infosolutions Ltd., a micro-cap player in the computers software and consulting sector, reported a disappointing performance in Q1 FY27, with consolidated net profit plunging 62.79% quarter-on-quarter to ₹15.82 crores from ₹42.52 crores in Q4 FY26. The sharp decline came alongside a 34.07% sequential revenue contraction, raising concerns about operational sustainability despite the company maintaining a ₹1,485.95 crore market capitalisation. The stock closed at ₹272.00 on July 30, 2026, down 4.39% from the previous session, reflecting investor disappointment with the quarterly performance.
Read full news article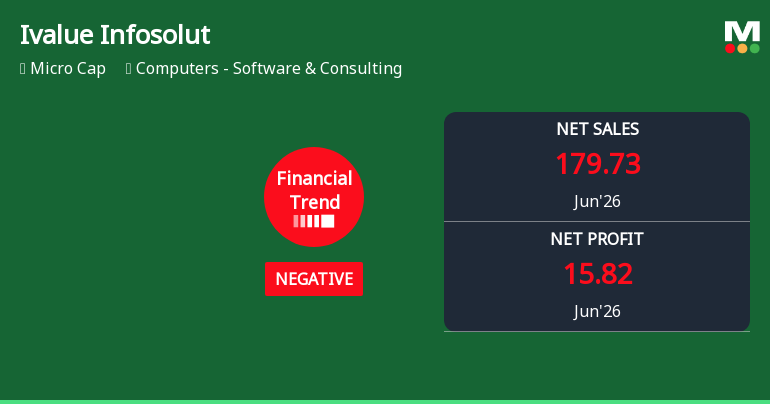
Ivalue Infosolutions Ltd Reports Sharp Decline in Quarterly Financial Performance Amid Changing Market Dynamics
Ivalue Infosolutions Ltd, a micro-cap player in the Computers - Software & Consulting sector, has reported a significant downturn in its financial performance for the quarter ended June 2026. The company’s latest results reveal a marked contraction in profitability and revenue, reversing the positive trend observed over the previous year and prompting a downgrade in its Mojo Grade from Buy to Hold.
Read full news article Announcements
Corporate Actions

No Upcoming Board Meetings

No Dividend history available

No Splits history available

No Bonus history available

No Rights history available
Quality key factors
Valuation key factors
Technicals key factors
 Technical Indicator Scale: Bearish, Mildly Bearish, Sideways, Mildly Bullish, Bullish Turned
 Shareholding Snapshot : Jun 2026
Shareholding Compare (%holding)
Non Institution
None
Held by 2 Schemes (6.87%)
Held by 14 FIIs (2.73%)
Sunil Kumar Pillai (13.9%)
Sundara (mauritius) Limited (10.43%)
32.93%
Quarterly Results Snapshot (Consolidated) - Jun'26 - QoQ

QoQ Growth in quarter ended Jun 2026 is -34.07% vs 20.80% in Mar 2026
QoQ Growth in quarter ended Jun 2026 is -62.79% vs 171.00% in Mar 2026
Half Yearly Results Snapshot (Standalone) - Sep'25
Not Applicable: The company has declared_date for only one period
Not Applicable: The company has declared_date for only one period
Nine Monthly Results Snapshot (Standalone) - Dec'25
Not Applicable: The company has declared_date for only one period
Not Applicable: The company has declared_date for only one period
Annual Results Snapshot (Consolidated) - Mar'26
YoY Growth in year ended Mar 2026 is 14.40% vs 18.26% in Mar 2025
YoY Growth in year ended Mar 2026 is 14.78% vs 20.48% in Mar 2025
About Ivalue Infosolutions Ltd

Company Coordinates


