
Compare Brady & Morris with Similar Stocks
Total Returns (Price + Dividend) 
Latest dividend: 1.5 per share ex-dividend date: Sep-09-2010
Risk Adjusted Returns v/s
Returns Beta

News

Brady & Morris Engineering Company Ltd is Rated Sell
Brady & Morris Engineering Company Ltd is rated Sell by MarketsMOJO, with this rating last updated on 16 February 2026. However, the analysis and financial metrics discussed here reflect the stock's current position as of 23 June 2026, providing investors with the latest insights into its performance and outlook.
Read full news article
Brady & Morris Engineering Company Ltd is Rated Sell
Brady & Morris Engineering Company Ltd is rated Sell by MarketsMOJO, with this rating last updated on 16 February 2026. However, the analysis and financial metrics presented here reflect the stock’s current position as of 12 June 2026, providing investors with the latest insights into the company’s performance and outlook.
Read full news article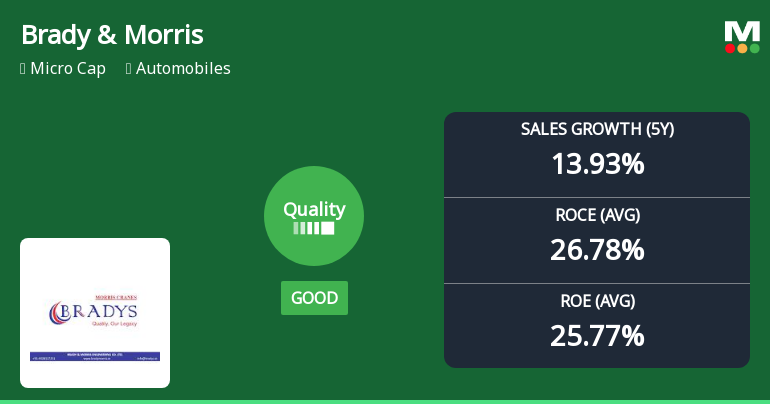
Brady & Morris Engineering Company Ltd Quality Grade Upgrade: A Detailed Fundamental Analysis
Brady & Morris Engineering Company Ltd has recently seen its quality rating upgraded from average to good, reflecting notable improvements in its core business fundamentals. Despite a challenging market environment and a recent downgrade in its overall Mojo Grade to Sell, the company’s financial metrics reveal a more robust operational profile, particularly in profitability and capital efficiency. This article analyses the key parameters behind this quality upgrade, including return ratios, debt levels, and growth consistency, providing investors with a comprehensive understanding of the company’s evolving financial health.
Read full news article Announcements
Compliances-Reg.24(A)-Annual Secretarial Compliance
29-May-2026 | Source : BSEAnnual Secretarial Compliance Report for the FY ended March 31 2026
Announcement under Regulation 30 (LODR)-Newspaper Publication
29-May-2026 | Source : BSENewspaper Publication of Financial Results for the Quarter and Year ended March 31 2026.
Audited Financial Results For The Quarter And Year Ended March 31 2026
27-May-2026 | Source : BSEBrady & Morris Engineering Company Limited has submitted the Audited Financial Results for the Quarter and Year ended March 31 2026.
Corporate Actions

No Upcoming Board Meetings

Brady & Morris Engineering Company Ltd has declared 15% dividend, ex-date: 09 Sep 10

No Splits history available

Brady & Morris Engineering Company Ltd has announced 1:2 bonus issue, ex-date: 03 Jan 08

No Rights history available
Quality key factors
Valuation key factors
Technicals key factors
 Technical Indicator Scale: Bearish, Mildly Bearish, Sideways, Mildly Bullish, Bullish Turned
 Shareholding Snapshot : Mar 2026
Shareholding Compare (%holding)
Promoters
None
Held by 0 Schemes
Held by 1 FIIs (0.1%)
W.h. Brady And Co. Ltd. (72.73%)
R K S Distributors Private Limited (7%)
10.22%
Quarterly Results Snapshot (Standalone) - Mar'26 - QoQ

QoQ Growth in quarter ended Mar 2026 is -23.45% vs 75.60% in Dec 2025
QoQ Growth in quarter ended Mar 2026 is -37.44% vs 356.25% in Dec 2025
Half Yearly Results Snapshot (Standalone) - Sep'25
Growth in half year ended Sep 2025 is -25.35% vs 45.48% in Sep 2024
Growth in half year ended Sep 2025 is -58.26% vs 30.81% in Sep 2024
Nine Monthly Results Snapshot (Standalone) - Dec'25
YoY Growth in nine months ended Dec 2025 is -12.53% vs 29.26% in Dec 2024
YoY Growth in nine months ended Dec 2025 is -39.51% vs 18.17% in Dec 2024
Annual Results Snapshot (Standalone) - Mar'26
YoY Growth in year ended Mar 2026 is -19.05% vs 20.08% in Mar 2025
YoY Growth in year ended Mar 2026 is -76.80% vs 185.49% in Mar 2025
About Brady & Morris Engineering Company Ltd

Company Coordinates


