
Compare Accedere with Similar Stocks
Dashboard
Weak Long Term Fundamental Strength with an average Return on Equity (ROE) of 3.48%
- Poor long term growth as Operating profit has grown by an annual rate 12.85% of over the last 5 years
- Company's ability to service its debt is weak with a poor EBIT to Interest (avg) ratio of 0.06
With ROE of 14.8, it has a Very Expensive valuation with a 8.1 Price to Book Value
Reducing Promoter Confidence
Stock DNA
Computers - Software & Consulting
INR 43 Cr (Micro Cap)
55.00
20
0.00%
-0.07
14.82%
8.09
Total Returns (Price + Dividend) 
Accedere for the last several years.
Risk Adjusted Returns v/s
Returns Beta

News
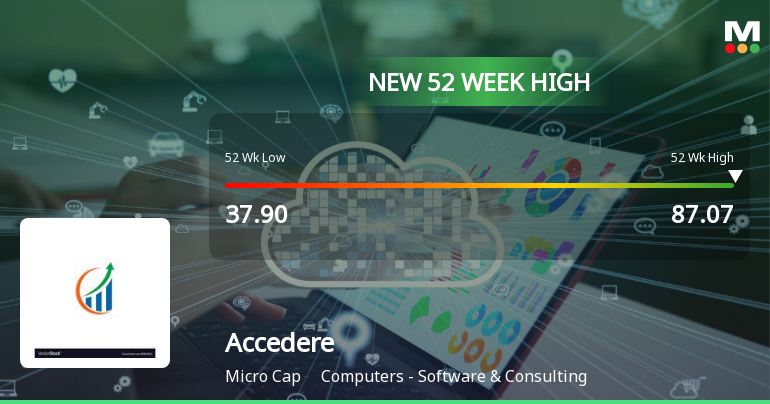
Broad-Based Technical Strength Lifts Accedere Ltd to 52-Week High of Rs 87.07
With a decisive surge to Rs 87.07 on 30 Jun 2026, Accedere Ltd has reached a new 52-week high, marking a significant milestone in its price momentum. This rally is underpinned by a confluence of bullish technical indicators across weekly and monthly timeframes, signalling robust momentum despite a mixed broader market backdrop.
Read full news article
Accedere Ltd Upgraded from Strong Sell to Sell Amid Mixed Technical and Financial Signals
Accedere Ltd, a micro-cap player in the Computers - Software & Consulting sector, has seen its investment rating upgraded from Strong Sell to Sell as of 24 June 2026. This change reflects a nuanced shift in the company’s technical outlook amid persistent fundamental weaknesses, prompting a reassessment of its near-term prospects by analysts.
Read full news article
Accedere Ltd is Rated Strong Sell
Accedere Ltd is rated Strong Sell by MarketsMOJO, with this rating last updated on 29 January 2026. However, the analysis and financial metrics discussed below reflect the company’s current position as of 18 June 2026, providing investors with the latest insights into the stock’s fundamentals, valuation, financial trends, and technical outlook.
Read full news article Announcements
Corporate Announcement
01-Jun-2026 | Source : BSECorporate Announcement
Financial Result For The Quarter Ended 31St March 2026
29-May-2026 | Source : BSEFinancial Result for the quarter ended 31st March 2026
Board Meeting Outcome for Outcome Of Board Meeting
29-May-2026 | Source : BSEOutcome of Board Meeting
Corporate Actions

No Upcoming Board Meetings

No Dividend history available

No Splits history available

Accedere Ltd has announced 1:10 bonus issue, ex-date: 06 Mar 26

No Rights history available
Quality key factors
Valuation key factors
Technicals key factors
 Technical Indicator Scale: Bearish, Mildly Bearish, Sideways, Mildly Bullish, Bullish Turned
 Shareholding Snapshot : Mar 2026
Shareholding Compare (%holding)
Promoters
None
Held by 0 Schemes
Held by 0 FIIs
Ashwin Chaudhary . (75.0%)
Anand Kumar . (2.8%)
23.87%
Quarterly Results Snapshot (Consolidated) - Mar'26 - QoQ

QoQ Growth in quarter ended Mar 2026 is 130.14% vs -26.26% in Dec 2025
QoQ Growth in quarter ended Mar 2026 is 6,400.00% vs -112.50% in Dec 2025
Half Yearly Results Snapshot (Consolidated) - Sep'25

Growth in half year ended Sep 2025 is -14.29% vs 160.26% in Sep 2024
Growth in half year ended Sep 2025 is 22.22% vs 250.00% in Sep 2024
Nine Monthly Results Snapshot (Consolidated) - Dec'25
YoY Growth in nine months ended Dec 2025 is -10.51% vs 56.82% in Dec 2024
YoY Growth in nine months ended Dec 2025 is -16.67% vs 0.00% in Dec 2024
Annual Results Snapshot (Consolidated) - Mar'26
YoY Growth in year ended Mar 2026 is 13.70% vs 42.58% in Mar 2025
YoY Growth in year ended Mar 2026 is 265.00% vs 385.71% in Mar 2025
About Accedere Ltd

Company Coordinates


