
Compare Accedere with Similar Stocks
Dashboard
Weak Long Term Fundamental Strength with an average Return on Equity (ROE) of 3.48%
- Poor long term growth as Operating profit has grown by an annual rate 12.85% of over the last 5 years
- Company's ability to service its debt is weak with a poor EBIT to Interest (avg) ratio of 0.06
With ROE of 14.8, it has a Expensive valuation with a 5.8 Price to Book Value
Reducing Promoter Confidence
Below par performance in long term as well as near term
Stock DNA
Computers - Software & Consulting
INR 27 Cr (Micro Cap)
39.00
20
0.00%
-0.07
14.82%
5.71
Total Returns (Price + Dividend) 
Accedere for the last several years.
Risk Adjusted Returns v/s
Returns Beta

News
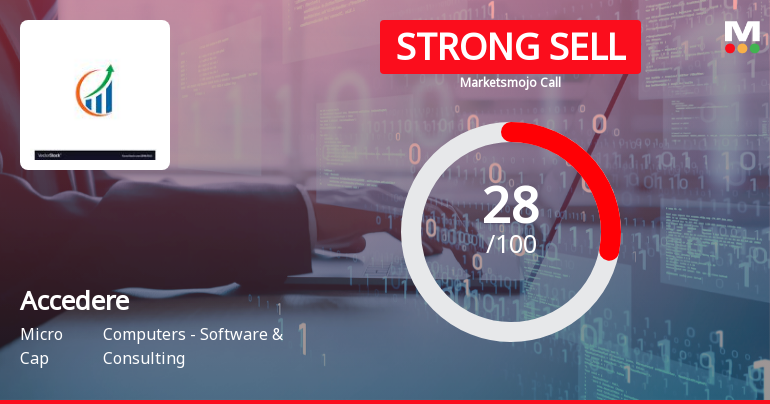
Accedere Ltd Downgraded to Strong Sell Amid Valuation and Technical Concerns
Accedere Ltd, a micro-cap player in the Computers - Software & Consulting sector, has been downgraded from a Sell to a Strong Sell rating by MarketsMOJO as of 7 July 2026. This revision reflects deteriorating technical indicators, a shift in valuation metrics, and concerns over the company’s financial trends and quality parameters despite recent positive quarterly results.
Read full news article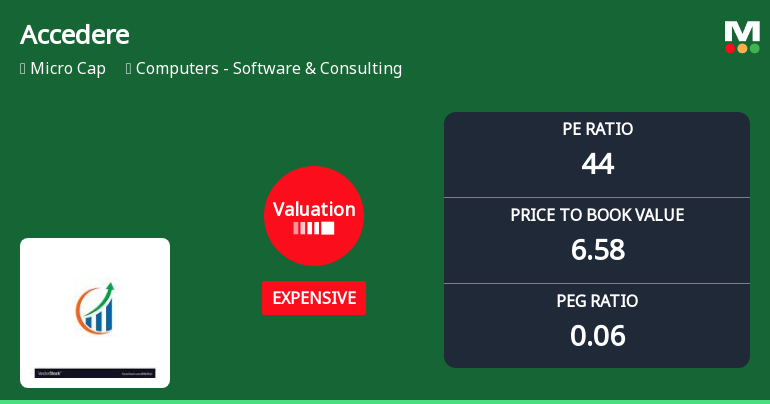
Accedere Ltd Valuation Shifts Amid Mixed Market Performance
Accedere Ltd, a micro-cap player in the Computers - Software & Consulting sector, has seen its valuation parameters shift notably, with price multiples remaining elevated despite recent price declines. The company’s price-to-earnings (P/E) and price-to-book value (P/BV) ratios continue to signal an expensive valuation relative to peers and historical averages, prompting a downgrade in its investment grade to Strong Sell.
Read full news article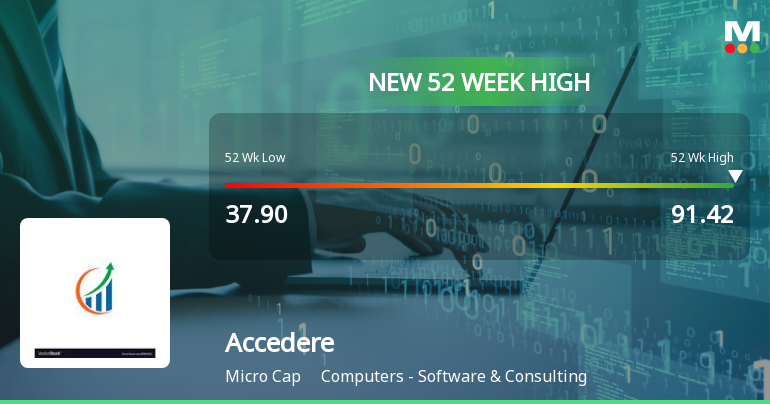
Broad-Based Technical Strength Lifts Accedere Ltd to 52-Week High of Rs 91.42
After a sustained six-day rally delivering over 30% returns, Accedere Ltd surged to a fresh 52-week high of Rs 91.42 on 1 Jul 2026, outpacing its sector by 4.45% amid a broadly positive market backdrop.
Read full news article Announcements
Compliances-Certificate under Reg. 74 (5) of SEBI (DP) Regulations 2018
14-Jul-2026 | Source : BSECompliance under Regulation 74(5)
Closure of Trading Window
30-Jun-2026 | Source : BSEClosure of trading window
Corporate Announcement
01-Jun-2026 | Source : BSECorporate Announcement
Corporate Actions

No Upcoming Board Meetings

No Dividend history available

No Splits history available

Accedere Ltd has announced 1:10 bonus issue, ex-date: 06 Mar 26

No Rights history available
Quality key factors
Valuation key factors
Technicals key factors
 Technical Indicator Scale: Bearish, Mildly Bearish, Sideways, Mildly Bullish, Bullish Turned
 Shareholding Snapshot : Mar 2026
Shareholding Compare (%holding)
Promoters
None
Held by 0 Schemes
Held by 0 FIIs
Ashwin Chaudhary . (75.0%)
Anand Kumar . (2.8%)
23.87%
Quarterly Results Snapshot (Consolidated) - Mar'26 - QoQ

QoQ Growth in quarter ended Mar 2026 is 130.14% vs -26.26% in Dec 2025
QoQ Growth in quarter ended Mar 2026 is 6,400.00% vs -112.50% in Dec 2025
Half Yearly Results Snapshot (Consolidated) - Sep'25

Growth in half year ended Sep 2025 is -14.29% vs 160.26% in Sep 2024
Growth in half year ended Sep 2025 is 22.22% vs 250.00% in Sep 2024
Nine Monthly Results Snapshot (Consolidated) - Dec'25
YoY Growth in nine months ended Dec 2025 is -10.51% vs 56.82% in Dec 2024
YoY Growth in nine months ended Dec 2025 is -16.67% vs 0.00% in Dec 2024
Annual Results Snapshot (Consolidated) - Mar'26
YoY Growth in year ended Mar 2026 is 13.70% vs 42.58% in Mar 2025
YoY Growth in year ended Mar 2026 is 265.00% vs 385.71% in Mar 2025
About Accedere Ltd

Company Coordinates


