
Compare Praveg with Similar Stocks
Dashboard
Poor long term growth as Operating profit has grown by an annual rate -9.31% of over the last 5 years
- PBT LESS OI(Q) At Rs -1.24 cr has Fallen at -244.4% (vs previous 4Q average)
- PAT(Q) At Rs -4.09 cr has Fallen at -562.3% (vs previous 4Q average)
- ROCE(HY) Lowest at 1.65%
Falling Participation by Institutional Investors
Below par performance in long term as well as near term
Stock DNA
Hotels & Resorts
INR 640 Cr (Micro Cap)
NA (Loss Making)
32
0.42%
0.29
-2.36%
1.37
Total Returns (Price + Dividend) 
Latest dividend: 1 per share ex-dividend date: Aug-01-2025
Risk Adjusted Returns v/s
Returns Beta

News

Praveg Ltd Upgraded to Sell: A Detailed Analysis of Quality, Valuation, Financial Trend, and Technicals
Praveg Ltd, a micro-cap player in the Hotels & Resorts sector, has seen its investment rating upgraded from Strong Sell to Sell as of 22 June 2026. This change reflects a nuanced improvement across technical indicators and valuation metrics, despite ongoing challenges in financial performance and long-term growth prospects.
Read full news article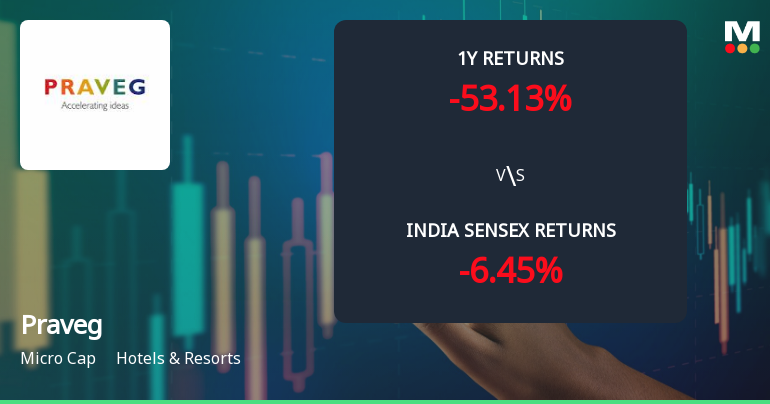
Praveg Ltd Technical Momentum Shifts Amid Mixed Market Signals
Praveg Ltd, a micro-cap player in the Hotels & Resorts sector, has experienced a nuanced shift in its technical momentum, moving from a bearish stance to a mildly bearish outlook. Despite a modest day decline of 0.32%, the stock’s technical indicators reveal a complex interplay of bullish and bearish signals, underscoring the challenges facing investors in this segment.
Read full news article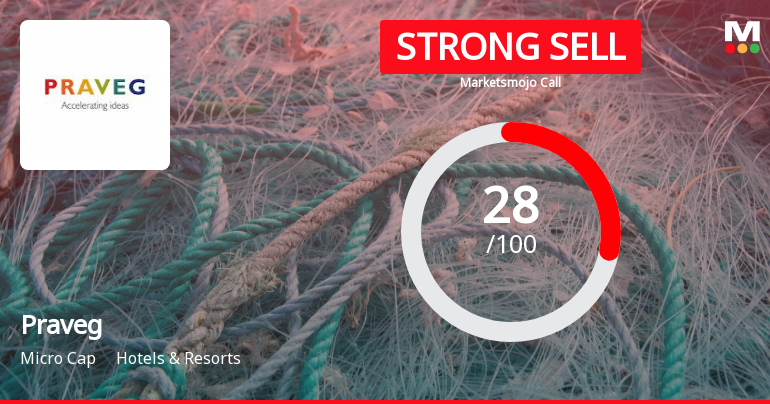
Praveg Ltd is Rated Strong Sell
Praveg Ltd is rated Strong Sell by MarketsMOJO, with this rating last updated on 09 June 2026. However, the analysis and financial metrics discussed here reflect the stock’s current position as of 21 June 2026, providing investors with an up-to-date view of the company’s fundamentals, returns, and market standing.
Read full news article Announcements
NCLT Convened Meeting Scheduled On July 18 2026
18-Jun-2026 | Source : BSENCLT convened Meeting Scheduled on July 18 2026
Announcement under Regulation 30 (LODR)-Newspaper Publication
18-Jun-2026 | Source : BSEThis has reference to our letter dated June 17 2026 informing about the meetings of (i) Equity Shareholders; (ii) Secured Creditors; and (iii) Unsecured Creditors to be held on Saturday July 18 2026 pursuant to the directions given by the Ahmedabad Bench of the Honble National Company Law Tribunal vide its order dated June 04 2026 in the matter of the proposed Scheme of Arrangement of Eulogia Inn Private Limited with Praveg Limited and its Shareholders and Creditors. In this regard we enclose herewith copies of the advertisement of notice of aforesaid meetings published in the following newspapers today i.e. Thursday July 18 2026: a) Indian Express in English language; and b) Divya Bhaskar in Vernacular (Gujarati) language.
Disclosure Under Regulation 30 Of The SEBI Listing Regulations 2015 - Order On Ongoing Litigation / Dispute Of GST
06-Jun-2026 | Source : BSEPursuant to Regulation 30 of the SEBI (Listing Obligations and Disclosure Requirements) Regulations 2015 read with sub-para 8 of para B of Part A of Schedule III thereto and the provisions of Annexure 18 of SEBI Master Circular No. SEBI/HO/CFD/PoD2/CIR/P/0155 dated January 30 2026 we hereby provide an update in respect of the order of the Deputy State Tax Office Roving Squad-V Chengalpattu Intelligence against Praveg Limited on December 18 2024. Against the order involving a disputed amount of Rs. 1783112/- the Company had preferred an appeal before the Appellate Authority. The Appellate Authority vide its order dated June 5 2026 has substantially allowed the Companys appeal and determined the liability at Rs. 20000/- only.
Corporate Actions

No Upcoming Board Meetings

Praveg Ltd has declared 10% dividend, ex-date: 01 Aug 25

No Splits history available

No Bonus history available

No Rights history available
Quality key factors
Valuation key factors
Technicals key factors
 Technical Indicator Scale: Bearish, Mildly Bearish, Sideways, Mildly Bullish, Bullish Turned
 Shareholding Snapshot : Mar 2026
Shareholding Compare (%holding)
Non Institution
None
Held by 0 Schemes
Held by 8 FIIs (2.73%)
Vishnubhai Vitthalbhai Patel (21.67%)
Sageone - Flagship Growth 2 Fund (2.29%)
33.66%
Quarterly Results Snapshot (Consolidated) - Mar'26 - QoQ

QoQ Growth in quarter ended Mar 2026 is -18.63% vs 141.20% in Dec 2025
QoQ Growth in quarter ended Mar 2026 is -153.88% vs 195.97% in Dec 2025
Half Yearly Results Snapshot (Consolidated) - Sep'25
Growth in half year ended Sep 2025 is 40.21% vs 110.92% in Sep 2024
Growth in half year ended Sep 2025 is -825.23% vs -33.13% in Sep 2024
Nine Monthly Results Snapshot (Consolidated) - Dec'25
YoY Growth in nine months ended Dec 2025 is 53.35% vs 84.73% in Dec 2024
YoY Growth in nine months ended Dec 2025 is -157.94% vs -0.79% in Dec 2024
Annual Results Snapshot (Consolidated) - Mar'26
YoY Growth in year ended Mar 2026 is 44.12% vs 82.51% in Mar 2025
YoY Growth in year ended Mar 2026 is -175.21% vs 17.92% in Mar 2025
About Praveg Ltd

Company Coordinates


