
Compare Setubandhan Inf. with Similar Stocks
Dashboard
Weak Long Term Fundamental Strength as the company has not declared results in the last 6 months
- Poor long term growth as Net Sales has grown by an annual rate of -24.40% and Operating profit at -71.04% over the last 5 years
- Low ability to service debt as the company has a high Debt to EBITDA ratio of 41.83 times
Flat results in Mar 23
Risky - No result in last 6 months
Total Returns (Price + Dividend) 
Latest dividend: 0.05 per share ex-dividend date: Oct-07-2016
Risk Adjusted Returns v/s
Returns Beta

News

Setubandhan Infrastructure Ltd Locks at Upper Circuit With 4.55% Gain — Buyers Queue, Sellers Absent
At Rs 0.46, the buying was done — not because demand dried up, but because the exchange wouldn't let the stock go any higher. Setubandhan Infrastructure Ltd locked at its upper circuit of 4.55% on 23 Jul 2026, with buyers queuing and no sellers willing to part with shares.
Read full news article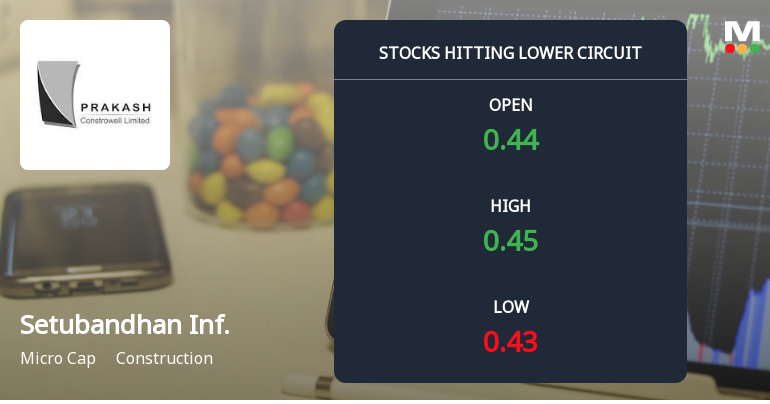
Setubandhan Infrastructure Ltd Locks at Lower Circuit With 2.22% Loss — Sellers Queue, No Buyers in Sight
At Rs 0.44, sellers were still queuing — but there were no buyers willing to take the other side. Setubandhan Infrastructure Ltd locked at its lower circuit of 2.22% on 22 Jul 2026, with unfilled sell orders and a frozen price.
Read full news article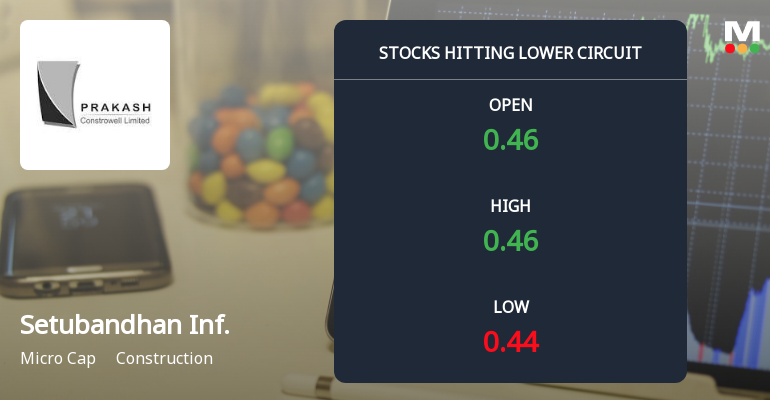
Setubandhan Infrastructure Ltd Locks at Lower Circuit With 4.35% Loss — Sellers Queue, No Buyers in Sight
At Rs 0.44, sellers were still queuing — but there were no buyers willing to take the other side. Setubandhan Infrastructure Ltd locked at its lower circuit of 4.35% on 21 Jul 2026, with unfilled sell orders and a frozen price.
Read full news article Announcements
Corporate Insolvency Resolution Process (CIRP)-Updates - Corporate Insolvency Resolution Process (CIRP)
21-Jul-2026 | Source : BSESetubandhan Infrastructure Limited has informed the Exchange regarding compliances for the Quarter ended on June 30 2026.
Closure of Trading Window
27-Jun-2026 | Source : BSEAs per Companys (Corporate Debtors) Code of Conduct for Prohibition of Insider Trading framed pursuant to SEBI (Prohibition of Insider Trading) Regulations 2015 and SEBI (Prohibition of Insider Trading) (Amendment) Regulation 2018 the Trading Window for dealing in Securities of the Company is closed for the purpose of declaration of the Unaudited Financial Results of the Corporate Debtor for the quarter ended on 30 June 2026 for all suspended Board of Directors / Designated Employees of the Company from 01 July 2026 till 48 hours from the RP Committee Meeting (in lieu of Suspended Board of Directors) in which the above results will be approved the date of which will be communicated in due course.
Corporate Insolvency Resolution Process (CIRP)-Updates - Corporate Insolvency Resolution Process (CIRP)
30-May-2026 | Source : BSESetubandhan Infrastructure Limited has informed the exchange of Non-Submission of Audited Financial Results (Standalone & Consolidated) for the Quarter and Year Ended 31st March 2026 under Regulation 33 of the SEBI (LODR) Regulations 2015 due to non-availability of information.
Corporate Actions

No Upcoming Board Meetings

Setubandhan Infrastructure Ltd has declared 5% dividend, ex-date: 07 Oct 16

Setubandhan Infrastructure Ltd has announced 1:10 stock split, ex-date: 13 Dec 12

No Bonus history available

No Rights history available
Quality key factors
Valuation key factors
Technicals key factors
 Technical Indicator Scale: Bearish, Mildly Bearish, Sideways, Mildly Bullish, Bullish Turned
 Shareholding Snapshot : Dec 2024
Shareholding Compare (%holding)
Non Institution
None
Held by 0 Schemes
Held by 0 FIIs
Prakash Pusaram Laddha (19.89%)
Rithik Sanjay Munot (3.28%)
61.5%
Quarterly Results Snapshot (Standalone) - Sep'23 - YoY

YoY Growth in quarter ended Sep 2023 is -100.00% vs -58.99% in Sep 2022
YoY Growth in quarter ended Sep 2023 is -161.04% vs 139.09% in Sep 2022
Half Yearly Results Snapshot (Standalone) - Sep'23
Growth in half year ended Sep 2023 is -100.00% vs -94.43% in Sep 2022
Growth in half year ended Sep 2023 is -337.50% vs 107.29% in Sep 2022
Nine Monthly Results Snapshot (Consolidated) - Dec'22
YoY Growth in nine months ended Dec 2022 is -50.18% vs 221.72% in Dec 2021

YoY Growth in nine months ended Dec 2022 is 140.69% vs 88.59% in Dec 2021
Annual Results Snapshot (Consolidated) - Mar'23
YoY Growth in year ended Mar 2023 is -36.48% vs 97.14% in Mar 2022
YoY Growth in year ended Mar 2023 is 101.47% vs 78.59% in Mar 2022
About Setubandhan Infrastructure Ltd

Company Coordinates


