
Compare Setubandhan Inf. with Similar Stocks
Dashboard
Weak Long Term Fundamental Strength as the company has not declared results in the last 6 months
- Poor long term growth as Net Sales has grown by an annual rate of -24.40% and Operating profit at -71.04% over the last 5 years
- Low ability to service debt as the company has a high Debt to EBITDA ratio of 41.83 times
Flat results in Mar 23
Risky - No result in last 6 months
Stock DNA
Construction
INR 6 Cr (Micro Cap)
NA (Loss Making)
47
0.00%
1.58
-4.12%
0.12
Total Returns (Price + Dividend) 
Latest dividend: 0.05 per share ex-dividend date: Oct-07-2016
Risk Adjusted Returns v/s
Returns Beta

News
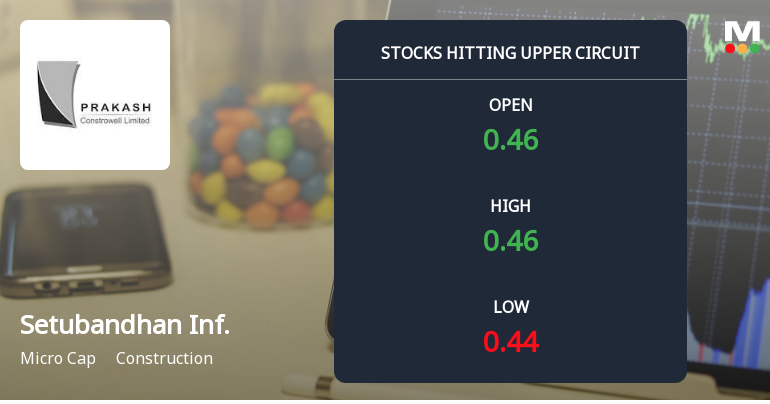
Setubandhan Infrastructure Ltd Locks at Upper Circuit With 4.55% Gain — Buyers Queue, Sellers Absent
At Rs 0.46, the buying was done — not because demand dried up, but because the exchange wouldn't let the stock go any higher. Setubandhan Infrastructure Ltd locked at its upper circuit of 4.55% on 19 Jun 2026, with buyers queuing and no sellers willing to part with shares.
Read full news article
Setubandhan Infrastructure Ltd Locks at Upper Circuit With 4.76% Gain — Buyers Queue, Sellers Absent
At Rs 0.44, the buying was done — not because demand dried up, but because the exchange wouldn't let the stock go any higher. Setubandhan Infrastructure Ltd locked at its upper circuit of 4.76% on 18 Jun 2026, with buyers queuing and no sellers willing to part with shares.
Read full news article
Setubandhan Infrastructure Ltd Locks at Upper Circuit With 2.27% Gain Amid Thin Liquidity
At Rs 0.46, the buying was done — not because demand dried up, but because the exchange wouldn't let the stock go any higher. Setubandhan Infrastructure Ltd locked at its upper circuit of 2.27% on 17 Jun 2026, with buyers queuing and no sellers willing to part with shares in a session marked by limited liquidity and subdued delivery volumes.
Read full news article Announcements
Corporate Insolvency Resolution Process (CIRP)-Updates - Corporate Insolvency Resolution Process (CIRP)
30-May-2026 | Source : BSESetubandhan Infrastructure Limited has informed the exchange of Non-Submission of Audited Financial Results (Standalone & Consolidated) for the Quarter and Year Ended 31st March 2026 under Regulation 33 of the SEBI (LODR) Regulations 2015 due to non-availability of information.
Results-Delay in Financial Results
30-May-2026 | Source : BSESetubandhan Infrastructure Limited has informed the exchange of Non-Submission of Audited Financial Results (Standalone & Consolidated) for the Quarter and Year Ended 31st March 2026 under Regulation 33 of the SEBI (LODR) Regulations 2015 due to non-availability of information.
Corporate Insolvency Resolution Process (CIRP)-Updates - Corporate Insolvency Resolution Process (CIRP)
21-Apr-2026 | Source : BSESetubandhan Infrastructure Limited has informed the Exchange regarding compliances for the Quarter and Year ended on 31 March 2026.
Corporate Actions

No Upcoming Board Meetings

Setubandhan Infrastructure Ltd has declared 5% dividend, ex-date: 07 Oct 16

Setubandhan Infrastructure Ltd has announced 1:10 stock split, ex-date: 13 Dec 12

No Bonus history available

No Rights history available
Quality key factors
Valuation key factors
Technicals key factors
 Technical Indicator Scale: Bearish, Mildly Bearish, Sideways, Mildly Bullish, Bullish Turned
 Shareholding Snapshot : Dec 2024
Shareholding Compare (%holding)
Non Institution
None
Held by 0 Schemes
Held by 0 FIIs
Prakash Pusaram Laddha (19.89%)
Rithik Sanjay Munot (3.28%)
61.5%
Quarterly Results Snapshot (Standalone) - Sep'23 - YoY

YoY Growth in quarter ended Sep 2023 is -100.00% vs -58.99% in Sep 2022
YoY Growth in quarter ended Sep 2023 is -161.04% vs 139.09% in Sep 2022
Half Yearly Results Snapshot (Standalone) - Sep'23
Growth in half year ended Sep 2023 is -100.00% vs -94.43% in Sep 2022
Growth in half year ended Sep 2023 is -337.50% vs 107.29% in Sep 2022
Nine Monthly Results Snapshot (Consolidated) - Dec'22
YoY Growth in nine months ended Dec 2022 is -50.18% vs 221.72% in Dec 2021

YoY Growth in nine months ended Dec 2022 is 140.69% vs 88.59% in Dec 2021
Annual Results Snapshot (Consolidated) - Mar'23
YoY Growth in year ended Mar 2023 is -36.48% vs 97.14% in Mar 2022
YoY Growth in year ended Mar 2023 is 101.47% vs 78.59% in Mar 2022
About Setubandhan Infrastructure Ltd

Company Coordinates


