
Compare JSW Dulux with Similar Stocks
Dashboard
High Management Efficiency with a high ROE of 25.77%
The company is Net-Debt Free
Poor long term growth as Net Sales has grown by an annual rate of 8.30% and Operating profit at 10.31% over the last 5 years
Flat results in Mar 26
With ROE of 16.1, it has a Attractive valuation with a 6 Price to Book Value
High Institutional Holdings at 30.22%
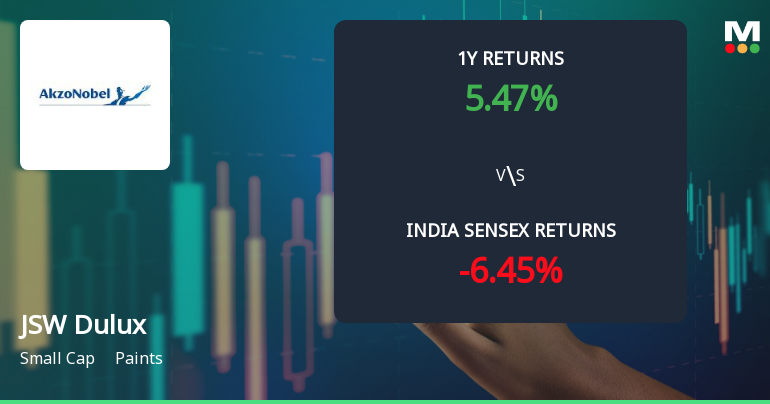
Total Returns (Price + Dividend) 
Latest dividend: 156.23068224651337 per share ex-dividend date: Aug-11-2025
Risk Adjusted Returns v/s
Returns Beta

News
JSW Dulux Ltd Technical Momentum Shifts Amid Mixed Indicator Signals
JSW Dulux Ltd has experienced a notable shift in its technical momentum, transitioning from a sideways trend to a mildly bearish stance. Despite a recent downgrade in its technical trend, the stock exhibits a complex interplay of bullish and bearish signals across key indicators such as MACD, RSI, Bollinger Bands, and moving averages, reflecting a nuanced outlook for investors in the paints sector.
Read full news article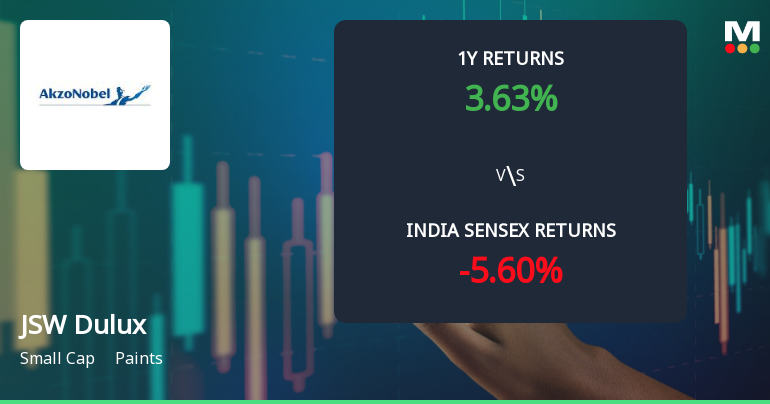
JSW Dulux Ltd Technical Momentum Shifts Signal Mixed Outlook Amid Market Recovery
JSW Dulux Ltd has exhibited a notable shift in its technical momentum, moving from a mildly bearish stance to a sideways trend, reflecting a nuanced market sentiment. The stock’s recent 2.06% gain to ₹3,296.35, coupled with mixed signals from key technical indicators such as MACD, RSI, and moving averages, suggests a complex interplay of bullish and bearish forces shaping investor outlook in the paints sector.
Read full news article
JSW Dulux Ltd is Rated Hold by MarketsMOJO
JSW Dulux Ltd is rated 'Hold' by MarketsMOJO, with this rating last updated on 26 May 2026. While the rating change occurred on that date, the analysis and financial metrics discussed here reflect the stock's current position as of 19 June 2026, providing investors with the latest insights into the company’s performance and outlook.
Read full news article Announcements
Letter Sent To Members Regarding AGM Notice And Annual Report.
17-Jun-2026 | Source : BSEAttached please find copy of the letter sent to those members who have not registered their email IDs informing them about the Notice of the Annual General Meeting and the Annual Report 2025-26
Announcement under Regulation 30 (LODR)-Newspaper Publication
17-Jun-2026 | Source : BSEAttached newspaper publication regarding Notice of AGM
Announcement under Regulation 30 (LODR)-Newspaper Publication
16-Jun-2026 | Source : BSENewspaper publication regarding Special Window
Corporate Actions

No Upcoming Board Meetings

JSW Dulux Ltd has declared 500% dividend, ex-date: 03 Jul 26

No Splits history available

No Bonus history available

No Rights history available
Quality key factors
Valuation key factors
Technicals key factors
 Technical Indicator Scale: Bearish, Mildly Bearish, Sideways, Mildly Bullish, Bullish Turned
 Shareholding Snapshot : Mar 2026
Shareholding Compare (%holding)
Promoters
None
Held by 25 Schemes (18.55%)
Held by 115 FIIs (8.44%)
Jsw Paints Limited (61.2%)
Hdfc Mutual Fund - Hdfc Childrens Fund (6.21%)
6.29%
Quarterly Results Snapshot (Consolidated) - Mar'26 - QoQ

QoQ Growth in quarter ended Mar 2026 is -1.24% vs 7.13% in Dec 2025

QoQ Growth in quarter ended Mar 2026 is 69.18% vs -95.58% in Dec 2025
Half Yearly Results Snapshot (Consolidated) - Sep'25
Growth in half year ended Sep 2025 is -9.34% vs 3.23% in Sep 2024
Growth in half year ended Sep 2025 is 734.73% vs 4.12% in Sep 2024
Nine Monthly Results Snapshot (Consolidated) - Dec'25
YoY Growth in nine months ended Dec 2025 is -11.23% vs 2.71% in Dec 2024
YoY Growth in nine months ended Dec 2025 is 475.55% vs 1.01% in Dec 2024
Annual Results Snapshot (Consolidated) - Mar'26
YoY Growth in year ended Mar 2026 is -11.55% vs 2.72% in Mar 2025
YoY Growth in year ended Mar 2026 is 359.56% vs 0.68% in Mar 2025
About JSW Dulux Ltd

Company Coordinates


