
Compare KSB with Similar Stocks
Dashboard
High Management Efficiency with a high ROE of 16.14%
The company is Net-Debt Free
Poor long term growth as Operating profit has grown by an annual rate 11.98% of over the last 5 years
With ROE of 17.2, it has a Very Expensive valuation with a 8.8 Price to Book Value
Majority shareholders : Promoters
Stock DNA
Compressors, Pumps & Diesel Engines
INR 14,886 Cr (Small Cap)
53.00
34
0.52%
-0.17
17.25%
8.84
Total Returns (Price + Dividend) 
Latest dividend: 4.4 per share ex-dividend date: May-08-2026
Risk Adjusted Returns v/s
Returns Beta

News
KSB Ltd is Rated Hold by MarketsMOJO
KSB Ltd is rated 'Hold' by MarketsMOJO, with this rating last updated on 08 June 2026. However, the analysis and financial metrics discussed here reflect the stock’s current position as of 03 August 2026, providing investors with the most up-to-date insight into the company’s performance and outlook.
Read full news article
KSB Ltd is Rated Hold by MarketsMOJO
KSB Ltd is rated 'Hold' by MarketsMOJO, with this rating last updated on 08 June 2026. However, the analysis and financial metrics discussed here reflect the stock's current position as of 23 July 2026, providing investors with an up-to-date view of the company’s fundamentals, valuation, financial trends, and technical outlook.
Read full news article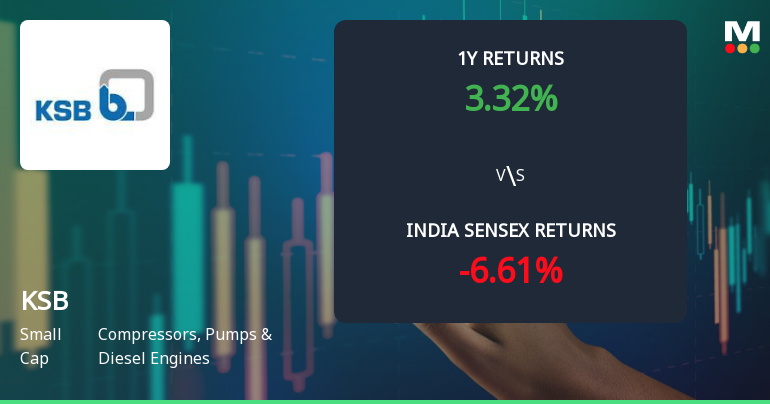
KSB Ltd Technical Momentum Shifts Amid Mixed Indicator Signals
KSB Ltd, a small-cap player in the Compressors, Pumps & Diesel Engines sector, has experienced a nuanced shift in its technical momentum, moving from a bullish to a mildly bullish stance. Despite a recent day decline of 1.53%, the stock’s longer-term technical indicators present a complex picture, with bullish MACD signals contrasting with mixed readings from other momentum and trend-following tools.
Read full news article Announcements
Board Meeting Intimation for The Meeting Scheduled To Be Held On 4Th August 2026.
22-Jul-2026 | Source : BSEKSB Ltdhas informed BSE that the meeting of the Board of Directors of the Company is scheduled on 04/08/2026 inter alia to consider and approve the Unaudited Financial Results (Standalone and Consolidated) for the quarter and half year ended 30th June 2026.
Closure of Trading Window
24-Jun-2026 | Source : BSEIntimation of closure of trading window.
Shareholder Meeting / Postal Ballot-Scrutinizers Report
22-May-2026 | Source : BSEPlease find enclosed herewith the voting results along with scrutinisers report of the 66th AGM.
Corporate Actions

04 Aug 2026

KSB Ltd has declared 220% dividend, ex-date: 08 May 26

KSB Ltd has announced 2:10 stock split, ex-date: 25 Jul 24

KSB Ltd has announced 1:1 bonus issue, ex-date: 18 Apr 11

No Rights history available
Quality key factors
Valuation key factors
Technicals key factors
 Technical Indicator Scale: Bearish, Mildly Bearish, Sideways, Mildly Bullish, Bullish Turned
 Shareholding Snapshot : Jun 2026
Shareholding Compare (%holding)
Promoters
None
Held by 24 Schemes (9.87%)
Held by 102 FIIs (4.1%)
Canadian Kay Pump Limited (40.54%)
Icici Prudential Infrastructure Fund (1.69%)
12.12%
Quarterly Results Snapshot (Consolidated) - Mar'26 - YoY

YoY Growth in quarter ended Mar 2026 is 0.99% vs 9.41% in Mar 2025
YoY Growth in quarter ended Mar 2026 is -22.87% vs 15.70% in Mar 2025
Half Yearly Results Snapshot (Consolidated) - Jun'25
Growth in half year ended Jun 2025 is 6.04% vs 10.11% in Jun 2024
Growth in half year ended Jun 2025 is 8.25% vs 8.68% in Jun 2024
Nine Monthly Results Snapshot (Consolidated) - Sep'25
YoY Growth in nine months ended Sep 2025 is 5.81% vs 9.86% in Sep 2024
YoY Growth in nine months ended Sep 2025 is 8.66% vs 13.39% in Sep 2024
Annual Results Snapshot (Consolidated) - Dec'25
YoY Growth in year ended Dec 2025 is 6.42% vs 12.72% in Dec 2024
YoY Growth in year ended Dec 2025 is 9.29% vs 18.59% in Dec 2024
About KSB Ltd

Company Coordinates


